


The Curious Case of Salesforce and Workday: Data Integration in the Cloud
 The growing enterprise adoption of Salesforce SFA/CRM, Workday HR, Netsuite ERP, Oracle on Demand, Force.com for apps and Amazon Web Services for e-commerce will result in more fragmented enterprise data scattered across the cloud.
Automating the moving, monitoring, securing and synchronization of data is no longer a “nice-to-have” but “must-have” capability.
Data quality and integration issues — aggregating data from the myriad sources and services within an organization — are CIOs and IT Architects top concern about SaaS and the main reason they hesitate to adopt it (Data security is another concern). They have seen this hosted data silo and data jungle problem too many times in the past. They know how this movie is likely to unfold.
Developing strategic (data governance), tactical (consistent data integration requirements) or operational (vendor selection) strategies to deal with this emerging “internal-to-cloud” data quality problem is a growing priority in my humble opinion. Otherwise most enterprises are going to get less than optimal value from various SaaS solutions. Things are likely to get out of control pretty quickly. Read more 
Do your KPIs Reflect Business Insights?
Obsolete KPIs can be Lethal
In the Aesopian fable of the one-eyed stag, a deer overcomes his visual handicap by grazing on a cliff near the sea with his good eye facing the land. Since all his known dangers were on land, this keeps him safe from predators for a very long time – until he is killed by a hunter in a boat.
The relevance of our KPIs can make or break our business. KPIs are often defined as static metrics for an enterprise and can easily become outdated. Economic uncertainty and competitive pressures are prompting questions on the validity of KPIs and performance management processes. To stay competitive requires a process of continually validating metrics with the business environment.
Another common challlenge with KPIs is that there are too many of them. Modern technology has gven us the ability to measure a very large number of parameters in the business. Some of these are more relevant than others. Jack Welch is known to have said, ”Too often we measure everything and understand nothing”. Monitoring some metrics and ignoring others are decisions we make based on our business perspective.
Relevance Enabled by Process
How do you decide on which KPI’s are most relevant to success? An often overlloked first step is to understand that primary business goals before looking at the technology solution. Avinash Kaushik defines KPIs simply as “Measures that help you understand how you are doing against your objectives”. This fundamental aproach is a good way of weeding out items which are not relevant to what we want as a business and avoid adverse surprises. At a more deeper level, building a robust Business Analytics solution requires answers to questions such as:
1. What events have the greatest impact on the busiens and how are they measured?
2. How often do you validate that you are measuring the right parameters ?
3. What instrumentation do you need to create the right dashbords for your KPI’s ? Can this instrumentation be updatd as teh KPIs change?
4. What is the process for collecting, synthesizing, manipulating and presenting the data to represent thsese metrics? How does the process change when if the metric change?
5. What technologies and architecture are necessary to support those decision-making patterns? Is there need for a “single source of truth” or a federated model possible?
Centers of Excellence
Needless to say, this approach requires a tight inegration between the business owners and IT acrchitects. A recent study by Gartner says that ”IT collaboration initiatives fail because IT leaders hold mistaken assumptions about basic issues…..rather than making technology the starting point, IT leaders should first identify real business problems and key performance indicators (KPIs) that link to business goals.”
Many business executives believe that IT is unable to deliver results where it counts. At the same time, IT organizations spend an incredible amount of time, money and resources simply reporting obvious data within their business process and workflows.
An organizational solution to this problem is the creation of a Competency Center or Center of Excellence (CoE) with representation from from both business and IT and shared objectives. The CoE defines the blueprint for implementing BI, Performance Management and Analytics aligend with KPIs. Some of the obvious benefits include:
- Cost savings from eliminating Silos
- Better collaboration between Business and IT
- Joint ownership of corporate objectives
There are other aspects of the CoE which make it a practical approach to creating an effective vehicle for deploying analytics solutions. The sheer volume and texture of busienss data is much more complicated than it has ever been in modern busienss history. The world’s data doubles every two years creating more opportunities for analyses. Understanding this data even at an aggregate level requires a business perspective combined with technological expertise. Furthernore, understanding technologies such as Big Data for unstrcutured data analysis requires business leaders and IT eimplementors to work together.
The CoE is the ideal structire to implement a Business Perspective Solution. A well implemented Business Perspective Solution takes into account the key objectives of the busienss, leverages sophisticated analytics technologies and focuses on sustainable processes to support decision making in an organization.
Superior decisions based on business perspective separate winners from losers.
Are your KPIs in sync with your business perspectives? Please share your comments below.
Further Reading
1. Six Web Metrics / Key Performance Indicators To Die For by Avinash Kaushik, Occam’s Razor
2. Practical BI – What CEOs want from BI and Analytics by Ravi Kalakota, Business Analytics 3.0
3. The Stupidity of KPIs in Business Analytics by Mark Smith, Ventana Reasearch
Analytics-as-a-Service: Understanding how Amazon.com is changing the rules
 “By 2014, 30% of analytic applications will use proactive, predictive and forecasting capabilities” Gartner Forecast
“More firms will adopt Amazon EC2 or EMR or Google App Engine platforms for data analytics. Put in a credit card, by an hour or months worth of compute and storage data. Charge for what you use. No sign up period or fee. Ability to fire up complex analytic systems. Can be a small or large player” Ravi Kalakota’s forecast
—————————-
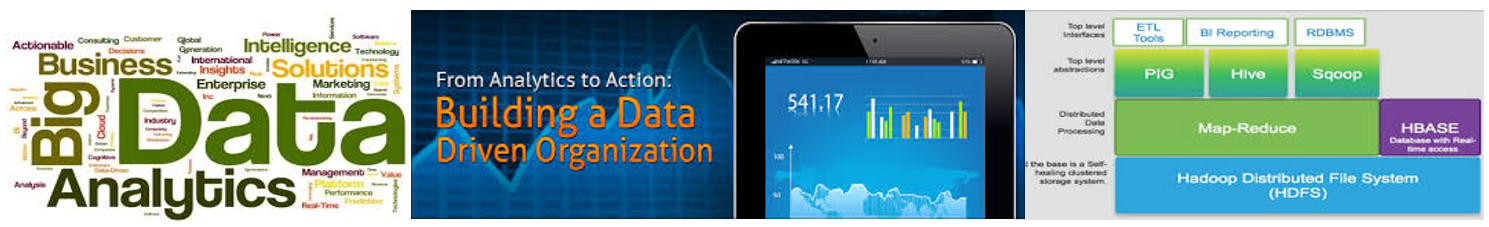
Big data Analytics = Technologies and techniques for working productively with data, at any scale.
Analytics-as-a-Service is cloud based… Elastic and highly scalable, No upfront capital expense. Only pay for what you use, Available on-demand
The combination of the two is the emerging new trend. Why? Many organizations are starting to think about “analytics-as-a-service” as they struggle to cope with the problem of analyzing massive amounts of data to find patterns, extract signals from background noise and make predictions. In our discussions with CIOs and others, we are increasingly talking about leveraging the private or public cloud computing to build an analytics-as-a-service model.
Analytics-as-a-Service is an umbrella term I am using to encapsulate “Data-as-a-Service” and “Hadoop-as-a-Service” strategies. It is more sexy 🙂
The strategic goal is to harness data to drive insights and better decisions faster than competition as a core competency. Executing this goal requires developing state-of-the-art capabilities around three facets: algorithms, platform building blocks, and infrastructure.
Analytics is moving out of the IT function and into business — marketing, research and development, into strategy. As result of this shift, the focus is greater on speed-to-insight than on common or low-cost platforms. In most IT organizations it takes anywhere from 6 weeks to 6 months to procure and configure servers. Then another several months to load, configure and test software. Not very fast for a business user who needs to churn data and test hypothesis. Hence cloud-as-a-analytics alternative is gaining traction with business users.
Big Data, Analytics and KPIs in E-commerce and Retail Industry

- How to convert Lookers to Bookers…
- How to create unique and effective Digital Experiences that impact probability of purchase or likelihood of return.
- What offers might result in higher “take rates”
The change in consumer behavior and expectations that e-commerce, mobile and social media are causing is hugely significant – big data and predictive analytics will separate brand/retail winners from losers. This won’t happen overnight but the transformation is for real.
Retail Industry makes up a sizable part of the world economy (6-7%) and covers a large ecosystem – E-commerce, Apparel, Department Stores, Discount Drugstores, Discount Retailers, Electronics, Home Improvement, Specialty Grocery, Specialty Retailers and Consumer Product Goods suppliers.
Retail is increasingly is looking like a barbell – a brand oriented cluster at the high-end, a very thin middle, and a price sensitive cluster at the low end. The consumerization of technology is putting more downward pricing pressure in an already competitive “middle” retail environment. The squeeze is coming from e-commerce and new “point, scan and analyze” technologies that give shoppers decision making tools — powerful pricing, promotion and product information, often in real-time. Applications in iPhones and Droid, like Red Laser can scan barcodes and provide immediate price, product and cross-retailer comparisons. They can even point you to the nearest retailer who can give you free shipping (total cost of purchase optimization). This will lead to further margin erosion for retailers that compete based on price (a sizable chunk of the market in the U.S, Europe and Asia).
Data analytics is not new for retailers. Point of sale transactional data obtained from bar-codes first appeared in 1970s. A pack of Wrigley’s chewing gum was the first item scanned using Universal Product Code (UPC) in a Marsh Supermarket in Troy, Ohio in 1974. Since then, retailers have been applying analytics to get even smarter and speedup the entire industry value chain.

More recent use cases of retail analytics include: Read more
