Proctor & Gamble – Business Sphere and Decision Cockpits
Data-driven DNA is about having the right toolset, mindset, skillset and dataset to evolve a major brand and seize today’s omni-channel opportunities. Whether it’s retooling and retraining for the multiscreen attention economy, or introducing digital innovations that transform both retail and healthcare, P&G is bringing data into every part of its core strategies to fight for the customer.
—————————
Striving for market leadership in consumer products is a non-stop managerial quest. In the struggle for survival, the fittest win out at the expense of their rivals because they succeed in adapting themselves best to their environment.
CMOs and CIOs everywhere agree that analytics is essential to sales & marketing and that its primary purpose is to gain access to customer insight and intelligence along the market funnel – awareness, consideration, preference, purchase and loyalty.
In this posting we illustrate a best-in-class “run-the-business” with Data/Analytics Case Study at P&G. The case study demonstrates four key characteristics of data market leaders:
- A shared belief that data is a core asset that can be used to enhance operations, customer service, marketing and strategy
- More effective leverage of more data – corporate, product, channel, and customer – for faster results
-
Technology is only a tool, it is not the answer..!
- Support for analytics by senior managers who embrace new ideas and are willing to shift power and resources to those who make data-driven decisions
This case study of a novel construct called Business Cockpit (also called LaunchTower in the Biotech and Pharmaceutical Industry) illustrates the way Business Analytics is becoming more central in retail and CPG decision making.
Here is a quick summary of P&G Analytics program:
- Primary focus on improving management decisions at scale – did the analysis to identify time gap between information and application to decision making
- “Information and Decision Solutions” (IT) embeds over 300 analysts in leadership teams
- Over 50 “Business Suites” for executive information viewing and decision-making
- “Decision cockpits” on 50,000 desktops
- 35% of marketing budget on digital
- Real-time social media sentiment analysis for “Consumer Pulse”
- Focused on how to best apply and visualize information instead of discussion/debate about validity of data
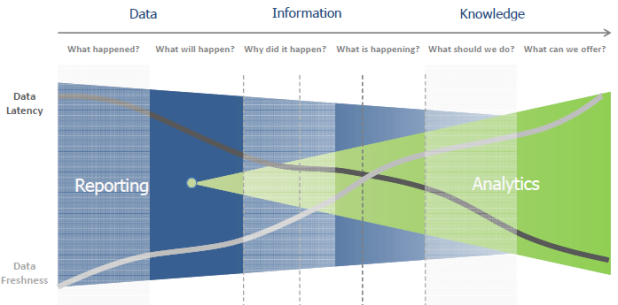

P&G Overview
“Data modeling, simulation, and other digital tools are reshaping how we innovate.” Bob McDonald, ex-CEO, Procter & Gamble. Digital strategies tend to play a vital role in defining the brand and connecting it with customers across the globe.
P&G’s has 127,000 employees and 300 brands sold in 180 countries. It has some of the the world’s best-known household names… includes 23 billion-dollar brands. P&G averages about 4 billion transactions daily. Last FY net sales: $83 billion. P&G CEO staked out a strategy to “digitize” the company’s processes from end to end, and Business Sufficiency, Business Sphere and Decision Cockpits is enabler of that agenda.
Data is an asset, treat it as such… P&G is building deeper analytics expertise at a time when P&G is cutting costs in other areas, including eliminating 1,600 non-manufacturing jobs. The company’s IT organization itself has cut $900 million in total spending over the past nine years. Continually evolving IT structure and culture to meet harder and harder targets.
P&G is investing in analytics talent, even as the company cuts in other areas, to speed up business decision making. True leaders develop the capabilities required for making good and timely decisions in unpredictable and stressful environments.
P&G analytics platform is a part of a wider strategic initiative which aims to support, provide and deliver insights to meet the needs of P&G in the multi-channel, multi-device, multi-format, multi-source, multi-language, multi-country and multi-culture world that it operates in.
CIO Filippo Passerini says he plans to increase fourfold the number of company staff with expertise in business analytics and Big Data. Global Business Services (GBS organization) is investing in analytics expertise (almost like a business competency center or center of excellence) because the model for using data to run a company is changing.
This is an example from Oracle World 2013 of how P&G GBS thinks about Big Data. Like other firms, P&G is facing a challenge: data volumes from many sources in multi-structured formats are exploding, and the business sees value in asking bigger questions of that data in real time.
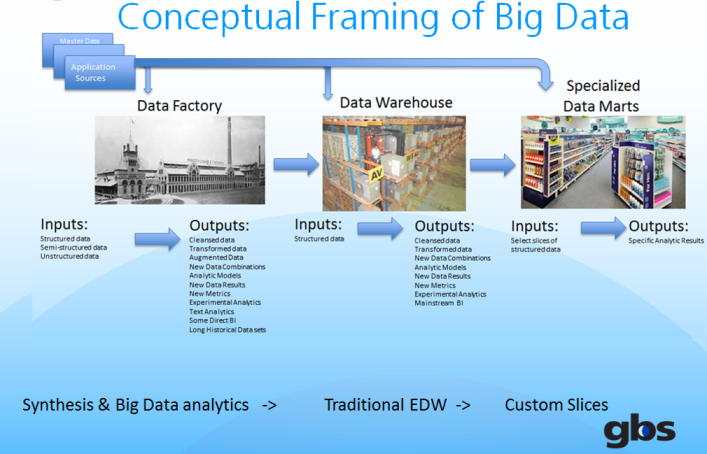 P&G GBS challenge is continuously adapting their tools, processes, skillsets and mindsets as the Hybrid Data Ecosystem continuously evolves.
is
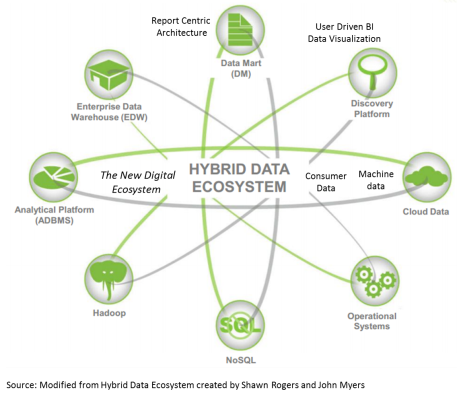
Business Sphere and Decision Cockpits
Making buried data in databases and spreadsheets understandable to ordinary people. Focus on how to best apply and visualize information instead of debating whether underlying data and data sources are correct (usually most of a meeting sometimes).
P&G has made available to 50,000 users analytical solutions called Business Sphere and Decision Cockpits. Business Sphere was developed in partnership with BOI, Cisco, HP, SAP, Nielsen and TIBCO Spotfire.
Focus is on accuracy of the information AND the interpretation. Objective is to Understand Correlation between two variables (events or actions) vs. Causation (one action directly causes another action). The broader strategic goal is to continuously enhance the customer experience online and in store.
The first project, launched in 2010, is the Business Sufficiency program, which gives executives predictions about P&G market share and other performance stats six to 12 months into the future. At its core is a series of analytic models designed to reveal what’s happening in the business now, why it’s happening, and what actions P&G can take.
The “what” models focus on data such as shipments, sales, and market share. The “why” models highlight sales data down to the country, territory, product line, and store levels, as well as drivers such as advertising and consumer consumption, factoring in region- and country-specific economic data. The “actions” analyses look at levers P&G can pull, such as pricing, advertising, and product mix, and provide estimates on what they deliver. (source: P&G Turns Analysis Into Action).
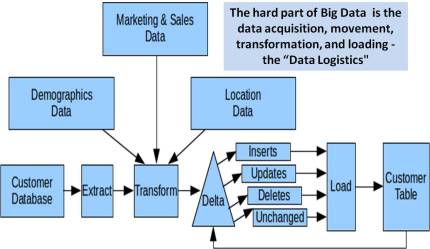 Business Sphere enables integration of technology, visualization, and information enables leaders to drill-down into data to get answers in real-time.
- To answer a set of questions, the program analyzes and connects as much as 200 terabytes of data, allowing for unprecedented granularity and customization.
- The way the data is presented uncovers insights, trends, and opportunities for the business leaders and prompts them to ask different and very focused business questions. If one question elicits a follow-up question, it can be addressed with data on-the-spot.
- The visualization helps people to “see” the data in ways they would not have been able to with just numbers and spreadsheets. It challenges assumptions while simultaneously presenting the data in different ways, revealing potential solutions that previously may have not been apparent.
Evolution of the P&G Decision Making model

Business Sphere is aimed at helping people see and understand data. The goal is to compress the time needed for decision making.
Business Sphere draws from and attempts to impact all 5 Tenets of Modern Marketing: Targeting | Engagement | Analytics | Conversion | Decision Making.
Today’s “data-driven, customer-centric” (mobile, social, cloud) world is going to require marketing and merchandizing change…and a different approach.
The old IT model was to figure out which reports people wanted, capture the data, and deliver it to the key people weeks or days after the fact.
That model is an obsolete model. The new model is something of a virtual, instant-on war room, where people huddle in person or by video around the needed data, pulling in the right experts to fix a problem the moment it arises.
This decision-making environment requires better collaboration via easy-to-use video, more real-time data, and business analytics expertise.
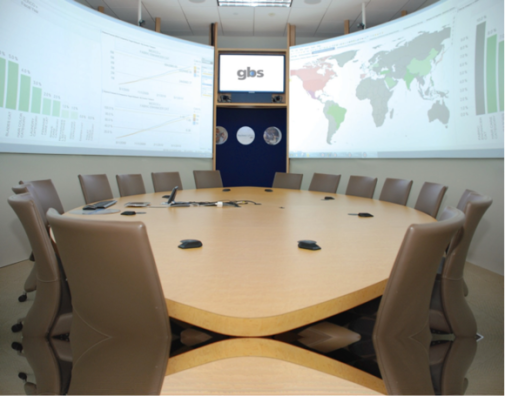
A new building block is high-quality videoconferencing, because people solve hard problems faster and better when they can see one anothe. P&G has been an avid user for several years of room-sized Cisco telepresence systems. The video is used as part of a collaboration environment P&G calls Business Sphere, which the executive council use to collaborate with colleagues worldwide. It combines video with large screens that display data visualizations on sales, market share, ad spending and the like, so everyone in the meeting is seeing the same information. In the past year, P&G added 50 smaller Business Sphere systems around the world, giving more people access to the technology.
The GBS team is working on a video platform that broadens access even more by letting people join in regardless of the video system they’re using, whether it’s Cisco telepresence or WebEx or FaceTime. That would mean a key team member can video in from an iPad, Droid smartphone, or PC if need be.In terms of data, this strategy needs the right real-time data.
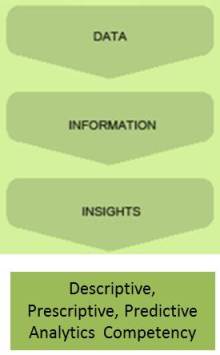 What’s real time? The goal P&G’s working toward is that as soon as data is collected, it’s available for use. P&G isn’t after new data types; it still wants to share and analyze point-of-sale, inventory, ad spending, and shipment data. What’s new is the higher frequency and speed at which P&G gets that data, and the finer granularity. P&G has about two-thirds of the real-time data it needs. P&G is loading more data every week than the week before.
The goal is to look at the what, why, and how of a problem. “What” is the problem itself — is the market share stable or has it shrunk two points? Crowd-sourcing the problem means empowering and giving 58,000 employees business intelligence “cockpits,” which are dashboards that link to common data sources so people spend little time arguing over whose data to use.”Why” is the cause of a problem — was it a bad TV ad, out-of-stock shelves, or a competitor’s new product or price cut that caused a problem? Right now, the P&G IT team is working on automating analysis of the why, so employees get alerts when key events like a supply chain snafu or rival product launch happen.
If P&G can eliminate “what” discussions and some of the “why,” and decision-makers can jump right to how to solve a problem, “that radically increases the pace at which they do business”.
The final piece is bringing in that business analytics expertise. These are people “at the intersection of business and IT”. They need to be as well versed in P&G business issues as a marketing pro. And they need to be skilled in finding information, building data models, and creating simulations.
For example, when CEO and his executive committee meet each Monday, one data slice they look at is the “top 50”–combinations of products and country markets (Brazil hair care, perhaps, or U.S. pet care) that are the company’s 50 largest, making up about 60% of sales.
Data visualizations show at a glance if sales or share are moving materially. If they are, and executives want to drill down:
- Is a sales dip in detergent in France because of one retailer, so that’s where to focus?
- Is that retailer buying less only in France, or across Europe?
- Did P&G cut promotions or raise prices, letting a rival grab share, or is the category overall losing sales?
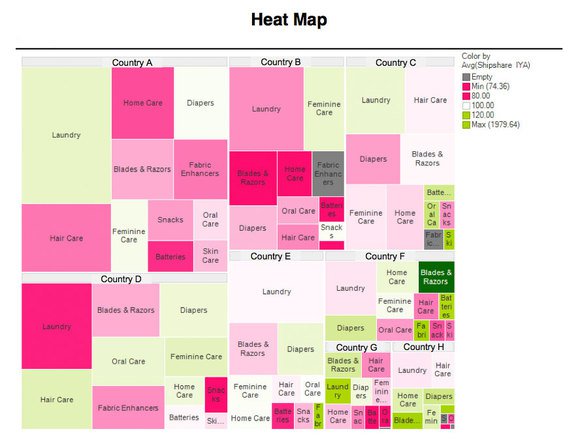
Data like Heat Maps below helps executives decide how to respond. Analytics experts sitting in on more meetings to make sure the “how” to solve problems gets sorted out right then and there, not postponed until everyone gets more information. The old model would mean “let’s get back to this in two weeks,” but with the new model “You need to be able to answer that question immediately.”
Data Infrastructure in P&G – SAP and Oracle Exadata
P&G has collected data from its core SAP ERP and other applications for years, putting it in SAP BW and Oracle data warehouses (the latter now transitioning to Oracle Exadata). But before the Business Sufficiency program, all that work led to reporting silos that were hard to correlate. Individual country and product line managers could see their performance, but cross-company comparisons required labor-intensive data manipulation and analysis.
P&G’s Global Business Services — Transforming the way business is done
1999 – 2002 — Creation of Shared Services
• Service consolidation & basic infrastructure
• Re-site services to central locations
2003 – 2005 — Building a Progressive Business Model
• Strategic sourcing with external partners
• Run our services as businesses
• Business Service and IT integration
2006 – 2009 — Agility, Flexibility & Change Anticipation
• Dramatic IT-driven Innovation
• Ever greater reduction in costs
• 3-fold increase in org capacity & flow-to-work
2010 — …GBSe – Running Simpler, Flatter, Faster
• Focus on key audiences: employees, functions and BUs
• More dynamic identification of priorities
• Scaled capabilities to build, operate & deliver GBS service
2013 – Analytics
- For Analytics program…identified 88 business processes covering $79 Bln of the company’s operations
- Focused on time gap between information origination and application to business decision making
- Applied analytics models to compress the time needed for decision making
- Scaled analytics decision making by giving over 50,000 employees access to their customized “Decision Cockpit” or dashboard
- Focused on how to apply and visualize information instead of debate/discussion about data sources or data quality
Summary
Run-the-business vs. Change-the-Business…. P&G (like many other best in class firms like Nestle, Unilever) believes that yesterday’s marketing funnel (awareness, consideration, preference, purchase, loyalty) has to tweaked to work in today’s customer-centric world. The message is “the age of the empowered consumer nails the coffin on the marketing and sales funnel.”
What P&G leadership has done is actually remarkable. In my experience…there is a correlation between the size of the firm and the challenges around data handling. Data tends to be a political issue. Who controls data controls knowledge. So a lot of mind-games tend to be played in corporations as a result… I will give you access if you give me something in return. P&G seems have broken this logjam.
What’s next? The hard truth is, most advertising and marketing still is white noise. Consumers have learned to tune it out. The “same old, same old” is just that — the same, and old. For brands and campaigns to be effective, they must continuously change the conversation.
Notes and References
- Source: Chris Murphy, InformationWeek February 16, 2012 – http://www.informationweek.com/news/global-cio/interviews/232601003
- P&G Turns Analysis Into Action
- Here is a YouTube video with my friend Bruno Aziza interviewing P&G BI leadership about Business Sphere.
Related articles
- Big Data Analytics Use Cases (practicalanalytics.wordpress.com)
Trackbacks & Pingbacks
- Strata 2012: 3 Essential Skills of a Data Driven CEO | Datacentre Management . org
- Strata 2012: 3 Essential Skills of a Data Driven CEO – - Tech News AggregatorTech News Aggregator
- ROI on Analytics – Now we have Numbers | Business Analytics 3.0
- Business Analyitcs at Proctor & Gamble – Business Sphere and Decision Cockpits (Business Analytics 3.0) - 1530 words
- ROI on Analytics – Now We Have Numbers « c24 Application Hosting Specialists
- ROI on Analytics – Now We Have Numbers « BI24
- Making Money on Predictive Analytics – Tools, Consulting and Content | Business Analytics 3.0
- Big Data Makes Things Better - Dice News
- Data Visualization, Discovery and Visual Analytics – Use Cases, Tools, CoE, Vendors | Business Analytics 3.0


Greetings! Very helpful advice within this post! It is the little changes that will make the most significant changes. Thanks for sharing!
LikeLike