


Love, Sex and Predictive Analytics: Tinder, Match.com, and OkCupid
“Have we got a girl for you” Some very sophisticated machine learning and predictive analytics models are powering the online dating or hookup world.
A lot of innovation is taking place around real-time, geo-location based matching services. Coinciding with the trend toward mobile, there is a meaningful shift of usage from desktop to mobile devices. The mobile trend also enables tailored dating products to meet the varying romantic and hookup preferences of users.
Take for Match.com which debuted its online dating first site in the U.S. in April 1995. Today, the Match.com brand hosts sites in 24 countries, in fifteen different languages spanning five continents. Match.com offers an interactive way for singles to meet other singles with whom they might otherwise never cross paths.
How to model and predict human attraction? Match.com is powered by Synapse algorithm. Synapse learns about its users in ways similar to sites like Amazon, Neflix, and Pandora to recommend new products, movies, or songs based on a user’s preferences.
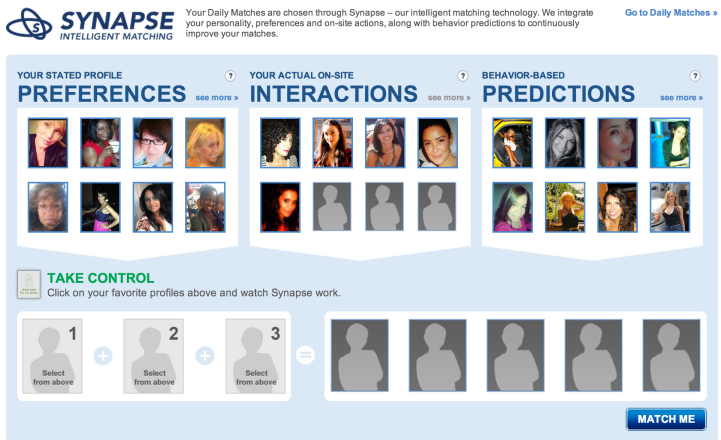
Enabling dating in a digital world… Match.com uses Chemistry.com to do personalized surveys and get detailed preference data. But when it comes to matching people based on their potential love and mutual attraction, however, analytics get significantly more complex when you are attempting to predict mutual match… the person A is a potential match for person B…. but with high probability that person B is also interested in person A. Read more 
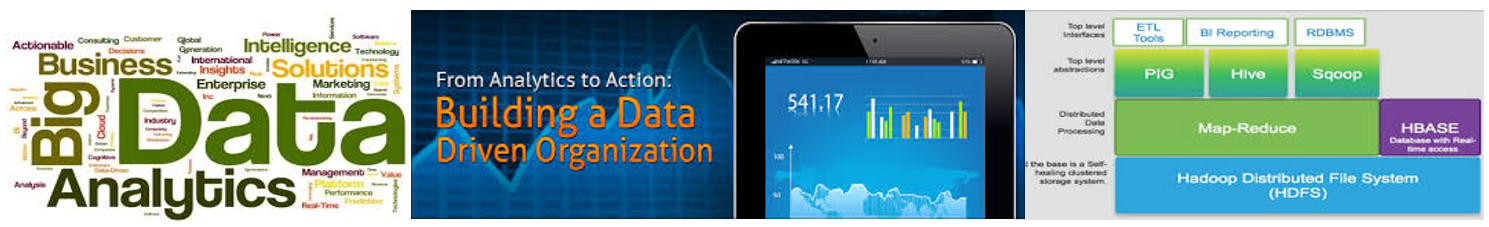
Data Science and Analytics Outsourcing – Vendors, Models, Steps
 Data-driven business processes are not a nice-to-have but a need-to-have capability today. So, if you’re an executive, manager, or team leader, one of your toughest assignments is managing and organizing your analytics and reporting initiative.
The days of business as usual are over. Data generation costs are falling everyday. The cost of collection and storage is also falling. The speed of insight-to-action business requirement is increasing. Systems of Record, Systems of Engagement, Systems of Insight are being transformed with consumerization and digital.
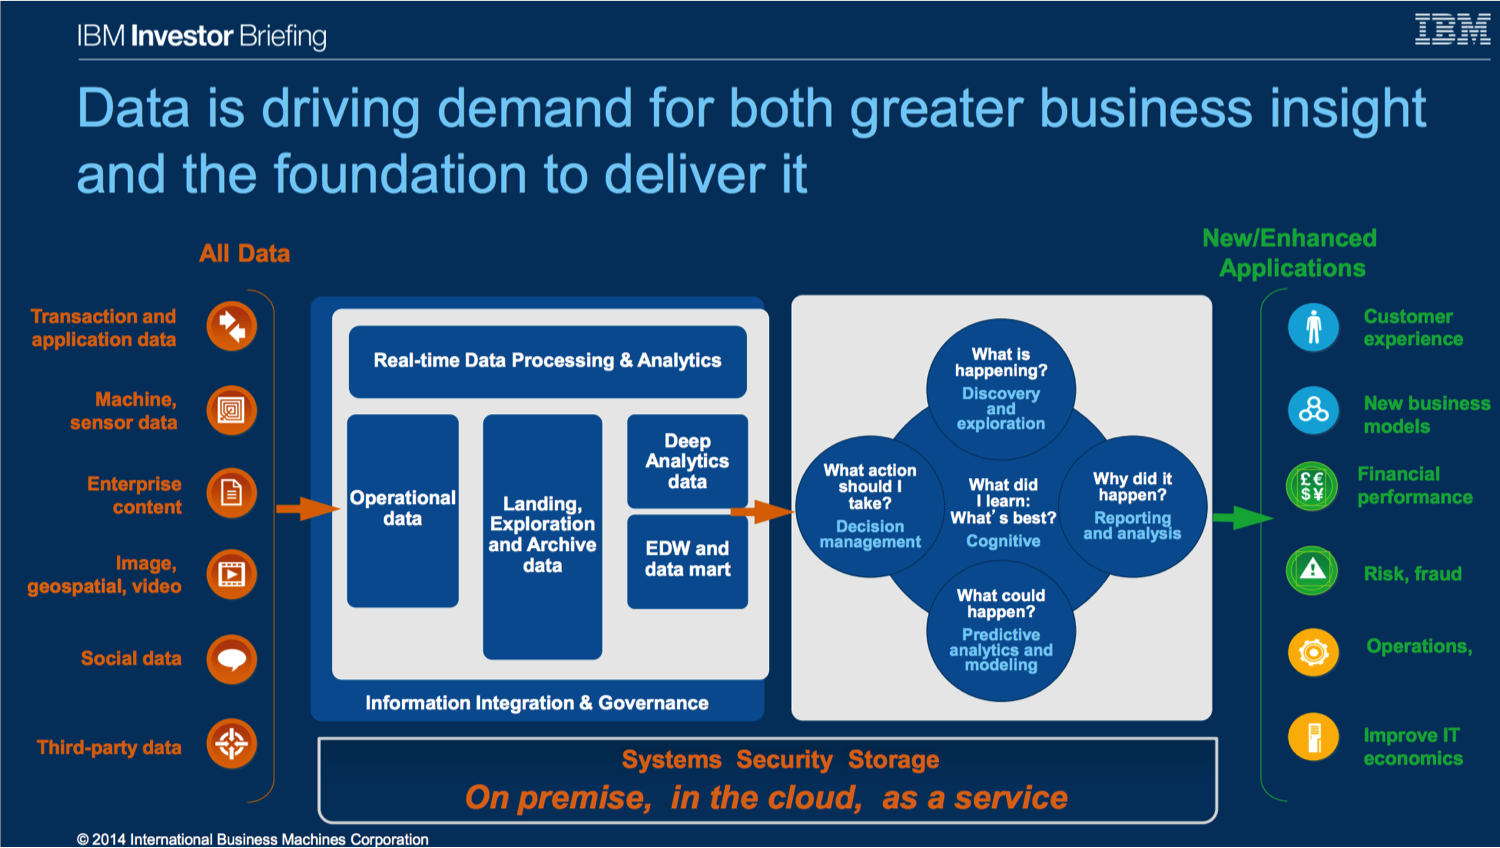
With this tsunami of data and new applications, the bottleneck is clearly shifting from transaction processing to Analytics & Insight-driven “sense-and-respond” Action. This slide from IBM’s Investor Briefing summarizes the data-driven transformation underway in most businesses.
Better/Faster/Cheaper Analytics Execution
Big Data Analytics Use Cases

Are you data-flooded, data-driven, data informed? Are you outcome oriented, insight driven or hindsight driven?
Are you a firm where executives claim – “Data is our competitive advantage.” Or sprout analogies like, “data is the new oil”.
The challenge I found in most companies is not dearth of vision… everyone has a strategy and a 100,000 ft general view of the importance or value of data. Every executive can parrot the importance of data and being data-driven.
The challenge is the next step….so, how are you going to create new data products? How are you going to execute a data driven strategy? How are you going to monetize data assets? What are the right business use cases to focus on? How to map the use case to underlying models and data requirements? What platform is a good long-term bet? The devil is in these details.
Everyone is searching for new ways to turn data into $$$ (monetize data assets). Everyone is looking for new levers to extract value from data. But data ingesting and modeling is simply a means to an end. The end is not just more reports, dashboards, heatmaps, knowledge, or wisdom. The target is fact based decisions, guided machine learning and actions. Another target is arming users to do data discovery and insight generation without involving IT teams…so called User-Driven Business Intelligence.
In other words, what is the use case that shapes the context for “Raw Data -> Aggregated Data -> Intelligence -> Insights -> Decisions -> Operational Impact -> Financial Outcomes -> Value creation.” What are the right use cases for the emerging hybrid data ecosystem (with structured and unstructured data)?
Data Visualization, Discovery and Visual Analytics – Use Cases, Tools, CoE, Vendors
 “Numerical quantities focus on expected values, graphical summaries on unexpected values.” – John Tukey, Exploratory Data Analysis, 1977.
Decision support needs better visualization. Scorecards, Dashboards, Heatmaps, Alerts, Management Reporting, Operations and Transactions Reporting are all enterprise example of data visualization outputs.
Some data visualization examples include:
- Data Scientist — uses “R”, a programming language used for statistical modeling, to understand traffic flows and congestion patterns and advise on options to improve travel times for Amazon.com Local delivery drivers.
- Pharmaceutical Sales Representative — uses QlikView on an iPad to access current industry sales trends and doctor prescription history while on a sales call with a busy physician.
- Healthcare Chief Medical Officer — uses Tableau Software to analyze all aspects of hospital performance including population management, emergency room effectiveness and Affordable Care Act compliance.
- Crime Analyst— uses Microstrategy to maintain a consolidated view of crime levels and optimize staffing allocations to dispatch police into high crime areas.
- Retail Store Manager — uses QlikView to analyze which products are selling best which impacts store assortments and which products get featured vs which ones get discontinued.
- Telecom Customer Service Agent — uses Spotfire to monitor call center statistics and how it translates into customer satisfaction and retention.

