


Analytics-as-a-Service: Understanding how Amazon.com is changing the rules
 “By 2014, 30% of analytic applications will use proactive, predictive and forecasting capabilities” Gartner Forecast
“More firms will adopt Amazon EC2 or EMR or Google App Engine platforms for data analytics. Put in a credit card, by an hour or months worth of compute and storage data. Charge for what you use. No sign up period or fee. Ability to fire up complex analytic systems. Can be a small or large player” Ravi Kalakota’s forecast
—————————-
Big data Analytics = Technologies and techniques for working productively with data, at any scale.
Analytics-as-a-Service is cloud based… Elastic and highly scalable, No upfront capital expense. Only pay for what you use, Available on-demand
The combination of the two is the emerging new trend. Why? Many organizations are starting to think about “analytics-as-a-service” as they struggle to cope with the problem of analyzing massive amounts of data to find patterns, extract signals from background noise and make predictions. In our discussions with CIOs and others, we are increasingly talking about leveraging the private or public cloud computing to build an analytics-as-a-service model.
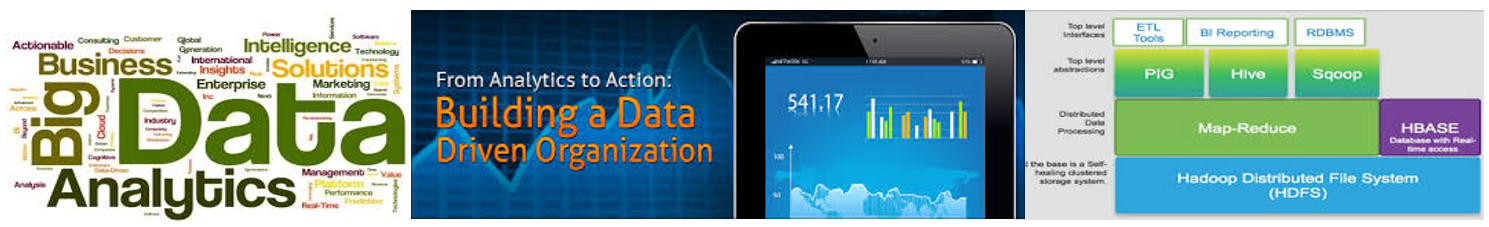
Analytics-as-a-Service is an umbrella term I am using to encapsulate “Data-as-a-Service” and “Hadoop-as-a-Service” strategies. It is more sexy 🙂
The strategic goal is to harness data to drive insights and better decisions faster than competition as a core competency. Executing this goal requires developing state-of-the-art capabilities around three facets: algorithms, platform building blocks, and infrastructure.
Analytics is moving out of the IT function and into business — marketing, research and development, into strategy. As result of this shift, the focus is greater on speed-to-insight than on common or low-cost platforms. In most IT organizations it takes anywhere from 6 weeks to 6 months to procure and configure servers. Then another several months to load, configure and test software. Not very fast for a business user who needs to churn data and test hypothesis. Hence cloud-as-a-analytics alternative is gaining traction with business users.
Proactive Risk Management – New KPIs for a Dodd-Frank World

The financial crisis of 2007–2011 is driving widespread changes in the U.S regulatory system. Dodd-Frank Act addresses “too big to fail” problem by tightening capital requirements and supervision of large financial firms and hedge funds. It also creates an “orderly liquidation authority” so the government can wind down a failing institution without market chaos.
Financial institutions will be spending billions to strengthen, streamline and automate their recordkeeping, risk management KPIs and dashboard systems. The implications on Data Retention and Archiving, Disaster Recovery and Continuity Planning have been well covered. But leveraging Business Analytics to proactively and reactively manage/monitor risk and compliance is an emerging frontier.
We believe that Business Analytics and real-time data management are poised to play a huge role in regulating the next generation of risk and compliance management in Financial Services industry (FSI). in this posting, we are going to examine the strategic and structural challenges, the dashboards and KPIs of interest that provide feedback, and what an effective execution roadmap needs to be for every organization.
Read more 
Mobile BI – Business KPIs and Dashboards “on-the-go”
 Who doesn’t want to achieve faster “time-to-information” and shorter “time-to-decision” for executives and managers with mobile BI? Who doesn’t want to disseminate insights or KPIs to front-line employees, such as field sales representatives, line of business managers, and field service employees?
The question is not whether Mobile BI is a good idea but how to execute this program in a low-cost way? How to design and deploy eye-popping “wow” apps? How to support, maintain and enhance these apps which are constantly changing? What technology and infrastructure to put in for a national or global deployment? Who is going to fund all this plumbing – corporate, LoB or IT?
 Business Analytics solutions for “always-on” 3/4G enabled mobile devices – iPads, iPhones, tablets, smart phones – are becoming prevalent as the form factor becomes appropriate for BI. We are increasingly seeing firms build state-of-the-art dashboard solutions for iPads. The “post-desktop” apps provide senior management with intuitive interactive access to the company’s most important business KPIs and dealing with data overload.
Tablets, 4G Wireless and next gen displays (+gesture based, verbal interfaces) have enabled new productivity improvements and better ways to consume information, perform ad-hoc querying and scenario planning. Dashboard, heatmaps and scorecards on the iPad, iPhones and Androids are intuitive, attractive, powerful, available at any time and any place: a perfect mix for top managers, sales teams and even customers.
BI (and Information Management) is a natural fit for mobile devices. Managers, blue and white workers spend a majority of their time away from their desks. Most are traveling, walking about or driving from site to site. And it’s these mobile workers who need the most up-to-date information. They need mobile BI to retrieve data to make on-the-spot decisions, monitor operational processes and review KPI, and work-in-process dashboards.
Private Equity and BI/Analytics – Case Study of KKR & Co

Went to an interesting talk by Ed Brandman, CIO of KKR & Co, the legendary Private Equity firm, hosted by CIO Perspectives in New York city. KKR is using a custom Business Intelligence solution, called Portfolio Central, to track and manage their portfolio of 62 companies. This portfolio includes some well-known companies like First Data, Toys R Us, Sungard, Dollar General, HCA and others.
Traditional BI – 57 Channels (and nothin’ on)

“Dissatisfaction is the basis of progress. When we become satisfied, we become obsolete.” J. Willard Marriott
—————————————
We talk to customers often about their dissatisfaction with things as they are and hear the same pattern of complaints. Despite increasing adoption of BI and data analytics tools, the current sets of tools are inadequate to meet the needs of users.
The market of BI is enormous. According the recent Census 2010, there are over 20,000 large and medium-sized enterprises (organizations with over 500 employees) and ~ 7 million small businesses (organizations with ten to 500 employees) in the United States alone. Now include Europe and Asia and you can see the potential.
However, most organizations face the following limitations: Read more
Practical BI – What CEOs want from BI and Analytics
“There are many methods for predicting the future. For example, you can read horoscopes, tea leaves, tarot cards, or crystal balls. Collectively, these methods are known as “nutty methods.” Or you can put well-researched facts into sophisticated computer models, more commonly referred to as “a complete waste of time.”
Scott Adams, The Dilbert Future
————————-
Are you clear on your objective? What is the most important value proposition that you want to achieve through BI and analytics enabled strategies?
- Reduction in operating expenses
- Increased profitability
- Improve growth, competitiveness and market position
- Customer acquisition, loyalty and retention
- Product development and differentiation
The mis-alignment between what C-suite wants and what IT is capable of delivering is quite extraordinary. Many CFOs, CEOs believe that IT is unable to deliver results where it counts: the top line and bottom line. At the same time, IT organizations spend an incredible amount of time, money and resources simply reporting the obvious data within their business processes and workflows. The data overload is making find the obvious in the increasing tidal wave of structured and unstructured data a full-time job. As organizations emerge from the deep recession of 2008, the competitive pressures are putting even greater demands on the decision-making, KPIs and performance management processes of organizations.
To stay competitive means making better decisions more quickly. It means accelerating the “raw data -> clean data -> information -> insight -> decision cycle.” It dictates widening the scope and scale of the data management domain, the analytic landscape and the technological infrastructure.

Data Visualization- The Medium is the Message
Marshall McLuhan‘s enigmatic phrase – medium is the message- from the sixties gives him credit for predicting the World Wide Web 30 years ago. He could have just as well have been talking about Data Visualization for Business Analytics. While information management technology has grown at a blistering pace, the human ability to process and comprehend numerical data has not.
Visualization opens up the channel of communication between the technologists who create the data and the business people who act upon it. Data visualization tools, such as mashups, executive dashboards, KPI and performance scorecards and other data visualization technology, are becoming more popular and necessary to deal with mind numbing charts and exponential data growth.
However, the C-Suite has heard about the promise of dashboards and interactive scorecard for a few decades now and is typically dissatisfied with what they get from IT and the speed at which they get it. The big difference is that visualization technologies have finally advanced to a level where they can give actionable intelligence to the right people at the right time at the right place.
Lets take for instance an a mobile BI solution using a tool such as an Apple iPad. This gives the business executive the ability to manipulate the data with the ease of reading an e-book. The visualization library that you can draw upon to create an interactive experience on the iPad includes:

There are three critical business requirements addressed by such a solution. These are: Read more
