


2014 Year in PreReview for Big Data Analytics
In the movie “Minority Report,” set in 2054, Tom Cruise plays the captain of the “PreCrime” police force, which uses “precognitive” abilities of mutants to stop crime before it happens. Silicon Valley futurists have sometimes used this reference in the context of the art of the possible with Big Data. We have another 40 years to go to see how analytics can accurately forecast future events based on human behavior. Meanwhile, imagining the future with some level of accuracy is within our reach today.
Value creation in the data economy made headlines in 2014. While Big Data continued to be the buzzword of the year in 2014, solutions that created economic impact were center stage. Trending terms such as “predictive analytics” and “advanced analytics” approached the levels of “Big Data” on Google Trends during the year. “ROI,” which was vaguely referenced in the last two years, became the most commonly used term with Big Data in 2014. Here is a cross-section of 2014 events.
Apple announces TopsyTV
This is their next-generation TV appliance that integrates social media engagement with the TV watching experience. Earlier in 2013, Apple acquired Topsy Labs, a reseller for Twitter content for $200M. This was followed by a series of less publicized acquisitions of social media data companies. Apple is characteristically tight-lipped about its plans for monetizing this product with advertising, but speculation is rife that Apple is poised to get a piece of the $600 billion that is spent on advertising today.
Goldman Sachs – Big Data is a Disruptive Theme

Innovation Matrix
The following eight secular disruptive themes are what Goldman Sachs believe have the potential to reshape their categories and command greater investor attention in the coming years.
The Eight Themes:
- E-cigarettes – The potential to transform the tobacco industry
- Cancer Immunotherapy – The future of cancer treatment?
- LED Lighting – A large, early-stage and multi-decade opportunity
- Alternative Capital – Rise of a new asset class means growing risk for reinsurers
- Natural Gas Engines – Attractive economics drive strong, long-term penetration
- Software Defined Networking (SDN) – Re-inventing networking for the cloud era
- 3D Printing – Disruption materializing
- Big Data – Solutions trying to keep up with explosive data growth and complexity (Industrial Big Data and Personalized Big Data)
These eight themes – through product or business innovation – Goldman claims are poised to transform addressable markets or open up entirely new ones, offering growth insulated from the broader macro environment and creating value for their stakeholders.
Goldman focuses on the impact of creative destruction – a term made famous by the Austrian economist Joseph Schumpeter, which emphasized the fact that innovation constantly drives breeding of new leaders and replacement of the old.
Read more 
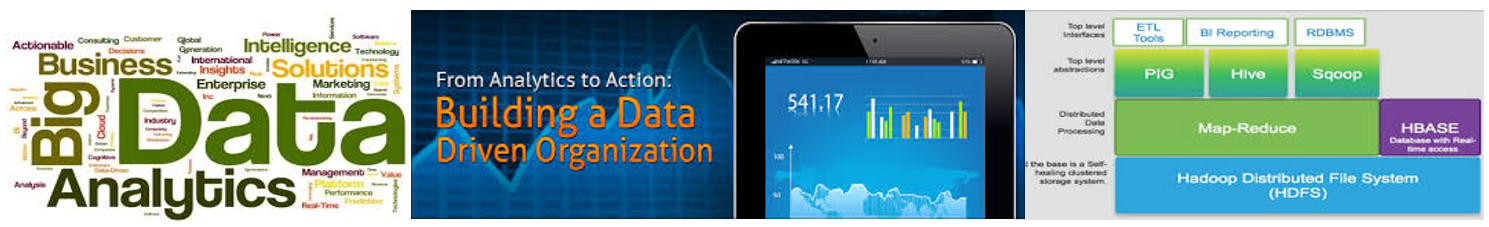
What is a “Hadoop”? Explaining Big Data to the C-Suite
 Keep hearing about Big Data and Hadoop? Having a hard time explaining what is behind the curtain?
The term “big data” comes from computational sciences to describe scenarios where the volume of the data outstrips the tools to store it or process it.
Three reasons why we are generating data faster than ever: (1) Processes are increasingly automated; (2) Systems are increasingly interconnected; (3) People are increasingly “living” online.
 As huge data sets invaded the corporate world there are new tools to help process big data. Corporations have to run analysis on massive data sets to separate the signal from the noisy data. Hadoop is an emerging framework for Web 2.0 and enterprise businesses who are dealing with data deluge challenges – store, process, index, and analyze large amounts of data as part of their business requirements.
So what’s the big deal? The first phase of e-commerce was primarily about cost and enabling transactions. So everyone got really good at this. Then we saw differentiation around convenience… fulfillment excellence (e.g., Amazon Prime) , or relevant recommendations (if you bought this and then you may like this – next best offer).
Then the game shifted as new data mashups became possible based on… seeing who is talking to who in your social network, seeing who you are transacting with via credit-card data, looking at what you are visiting via clickstreams, influenced by ad clickthru, ability to leverage where you are standing via mobile GPS location data and so on.
The differentiation is shifting to turning volumes of data into useful insights to sell more effectively. For instance, E-bay apparently has 9 petabytes of data in their Hadoop and Teradata cluster. With 97 million active buyers and sellers they have 2 Billion page view and 75 billion database calls each day. E-bay like others is racing to put in the analytics infrastructure to (1) collect real-time data; (2) process data as it flows; (3) explore and visualize. Read more
Oracle’s Analytics-as-a-Service Strategy: Exalytics, Exalogic and Exadata
 Following the success of its Exadata (database as a service) and Exalogic (middleware-as-a-service) engineered systems, Oracle unveiled Exalytics Business Intelligence at Oracle OpenWorld 2011.
The goal of these appliances (engineered systems) is to help IT groups further shrink data center costs, increase system utilization and enable better application integration. All goals that CIOs everywhere continue to struggle with. CIOs now face an interesting decision matrix: Exalytics/Logic/Data systems versus traditional build from components versus hosted.
With ExaSystems, Oracle has a tremendous market advantage. Oracle owns most of the software that enterprises need today. Via acquisitions, Oracle owns the whole stack! Web tier, Middleware, Database software, Database tier, Storage tier. With Sun Microsystems it’s ideally positioned to maximize the platform capabilities. It’s easy for Oracle make its own software play nice on the Exalytics, Exalogic and Exadata platforms.
Wanted: CIO – BI/Analytics
 In a tough economy, a new tech-fueled BI and analytics arms race is on to create the next competitive advantage.
Everyone is beginning to look beyond the status quo in BI, analytics, Big Data, Cloud Computing etc to fundamentally change how they discover fresh insights, how they can make smarter decisions, profit from customer intelligence and social media, and optimize performance management.
The headache for corporations is not the technology aspects but the leadership side. Who is going to lead this effort, corral the vendors and formalize and execute a more structured program.
Who is going to lead the effort to create the right toolset, dataset, skillset and mindset necessary for success?
As BI and Analytics moves from “experiment and test” lab projects to commercial deployments, companies are going to need more leadership and program management capabilities. They need leadership that can provide strategic, expert guidance for using powerful new technologies to find patterns and correlations in data transactions, event streams, and social media.
Some firms are making moves. In insurance, AIG – Chartis Inc. unit appointed Murli Buluswar to the new post of chief science officer. This aims to enhance Chartis’ focus on analytics… he “will be responsible for establishing a world-class R&D function to help improve Chartis’ global commercial and consumer business strategies and to deliver more value for customers.” This focus on analytics involves “asking the right questions and making science-driven decisions about strategies—whether it’s related to underwriting decisions, product innovation, pricing, distribution, marketing, claims or customer experience—with the end result of improving the scope of what Chartis delivers for customers”.
As a result of where we are in the maturity cycle and to support the business units better, we are seeing a new emerging role “CIO – BI” that is dotted lined to the global CIO or a shared services leader. Let’s look at a representative job posting from GE Capital, which always seems to be a step ahead of most companies. Read more
Do your KPIs Reflect Business Insights?
Obsolete KPIs can be Lethal
In the Aesopian fable of the one-eyed stag, a deer overcomes his visual handicap by grazing on a cliff near the sea with his good eye facing the land. Since all his known dangers were on land, this keeps him safe from predators for a very long time – until he is killed by a hunter in a boat.
The relevance of our KPIs can make or break our business. KPIs are often defined as static metrics for an enterprise and can easily become outdated. Economic uncertainty and competitive pressures are prompting questions on the validity of KPIs and performance management processes. To stay competitive requires a process of continually validating metrics with the business environment.
Another common challlenge with KPIs is that there are too many of them. Modern technology has gven us the ability to measure a very large number of parameters in the business. Some of these are more relevant than others. Jack Welch is known to have said, ”Too often we measure everything and understand nothing”. Monitoring some metrics and ignoring others are decisions we make based on our business perspective.
Relevance Enabled by Process
How do you decide on which KPI’s are most relevant to success? An often overlloked first step is to understand that primary business goals before looking at the technology solution. Avinash Kaushik defines KPIs simply as “Measures that help you understand how you are doing against your objectives”. This fundamental aproach is a good way of weeding out items which are not relevant to what we want as a business and avoid adverse surprises. At a more deeper level, building a robust Business Analytics solution requires answers to questions such as:
1. What events have the greatest impact on the busiens and how are they measured?
2. How often do you validate that you are measuring the right parameters ?
3. What instrumentation do you need to create the right dashbords for your KPI’s ? Can this instrumentation be updatd as teh KPIs change?
4. What is the process for collecting, synthesizing, manipulating and presenting the data to represent thsese metrics? How does the process change when if the metric change?
5. What technologies and architecture are necessary to support those decision-making patterns? Is there need for a “single source of truth” or a federated model possible?
Centers of Excellence
Needless to say, this approach requires a tight inegration between the business owners and IT acrchitects. A recent study by Gartner says that ”IT collaboration initiatives fail because IT leaders hold mistaken assumptions about basic issues…..rather than making technology the starting point, IT leaders should first identify real business problems and key performance indicators (KPIs) that link to business goals.”
Many business executives believe that IT is unable to deliver results where it counts. At the same time, IT organizations spend an incredible amount of time, money and resources simply reporting obvious data within their business process and workflows.
An organizational solution to this problem is the creation of a Competency Center or Center of Excellence (CoE) with representation from from both business and IT and shared objectives. The CoE defines the blueprint for implementing BI, Performance Management and Analytics aligend with KPIs. Some of the obvious benefits include:
- Cost savings from eliminating Silos
- Better collaboration between Business and IT
- Joint ownership of corporate objectives
There are other aspects of the CoE which make it a practical approach to creating an effective vehicle for deploying analytics solutions. The sheer volume and texture of busienss data is much more complicated than it has ever been in modern busienss history. The world’s data doubles every two years creating more opportunities for analyses. Understanding this data even at an aggregate level requires a business perspective combined with technological expertise. Furthernore, understanding technologies such as Big Data for unstrcutured data analysis requires business leaders and IT eimplementors to work together.
The CoE is the ideal structire to implement a Business Perspective Solution. A well implemented Business Perspective Solution takes into account the key objectives of the busienss, leverages sophisticated analytics technologies and focuses on sustainable processes to support decision making in an organization.
Superior decisions based on business perspective separate winners from losers.
Are your KPIs in sync with your business perspectives? Please share your comments below.
Further Reading
1. Six Web Metrics / Key Performance Indicators To Die For by Avinash Kaushik, Occam’s Razor
2. Practical BI – What CEOs want from BI and Analytics by Ravi Kalakota, Business Analytics 3.0
3. The Stupidity of KPIs in Business Analytics by Mark Smith, Ventana Reasearch
Analytics-as-a-Service: Understanding how Amazon.com is changing the rules
 “By 2014, 30% of analytic applications will use proactive, predictive and forecasting capabilities” Gartner Forecast
“More firms will adopt Amazon EC2 or EMR or Google App Engine platforms for data analytics. Put in a credit card, by an hour or months worth of compute and storage data. Charge for what you use. No sign up period or fee. Ability to fire up complex analytic systems. Can be a small or large player” Ravi Kalakota’s forecast
—————————-
Big data Analytics = Technologies and techniques for working productively with data, at any scale.
Analytics-as-a-Service is cloud based… Elastic and highly scalable, No upfront capital expense. Only pay for what you use, Available on-demand
The combination of the two is the emerging new trend. Why? Many organizations are starting to think about “analytics-as-a-service” as they struggle to cope with the problem of analyzing massive amounts of data to find patterns, extract signals from background noise and make predictions. In our discussions with CIOs and others, we are increasingly talking about leveraging the private or public cloud computing to build an analytics-as-a-service model.
Analytics-as-a-Service is an umbrella term I am using to encapsulate “Data-as-a-Service” and “Hadoop-as-a-Service” strategies. It is more sexy 🙂
The strategic goal is to harness data to drive insights and better decisions faster than competition as a core competency. Executing this goal requires developing state-of-the-art capabilities around three facets: algorithms, platform building blocks, and infrastructure.
Analytics is moving out of the IT function and into business — marketing, research and development, into strategy. As result of this shift, the focus is greater on speed-to-insight than on common or low-cost platforms. In most IT organizations it takes anywhere from 6 weeks to 6 months to procure and configure servers. Then another several months to load, configure and test software. Not very fast for a business user who needs to churn data and test hypothesis. Hence cloud-as-a-analytics alternative is gaining traction with business users.
Proactive Risk Management – New KPIs for a Dodd-Frank World

The financial crisis of 2007–2011 is driving widespread changes in the U.S regulatory system. Dodd-Frank Act addresses “too big to fail” problem by tightening capital requirements and supervision of large financial firms and hedge funds. It also creates an “orderly liquidation authority” so the government can wind down a failing institution without market chaos.
Financial institutions will be spending billions to strengthen, streamline and automate their recordkeeping, risk management KPIs and dashboard systems. The implications on Data Retention and Archiving, Disaster Recovery and Continuity Planning have been well covered. But leveraging Business Analytics to proactively and reactively manage/monitor risk and compliance is an emerging frontier.
We believe that Business Analytics and real-time data management are poised to play a huge role in regulating the next generation of risk and compliance management in Financial Services industry (FSI). in this posting, we are going to examine the strategic and structural challenges, the dashboards and KPIs of interest that provide feedback, and what an effective execution roadmap needs to be for every organization.
Read more
Harry Potter, The Elephant, The FBI and The Data Warehouse
 In the ancient Indian parable of the elephant, six blind men touch an elephant and report six very different views of the same animal. Compare this scenario to a data warehouse that is getting data from six different sources. “Harry Potter and the Sorcerer’s Stone” as a field in a database can be written as “HP and the Sorcerer’s Stone” or as “Harry Potter I” or simply – “Sorcerer’s Stone”. In the data warehouse these are four separate movie titles. For a Harry Potter fan, they are the same movie. Now increase the number of movies to cover the entire Harry Potter series and further include fifty languages. You now have a set of titles which may perplex even a real Harry Potter aficionado.
What does this have to do with data analytics?
