


Data-as-a-Service (DaaS)

If the analytics team wrestles with getting access to data, how timely are the insights?
To address the question…Global CIO are shifting their strategy — “need to build data-as-a-service offering for my data” to enable the analytics users in the organization. The more advanced CIOs are asking – “how should I build data science capabilities as a shared foundation service?”
The CIO challenge is not trivial. Successful organizations today operate within application and data eco-systems which extend across front-to-back functions (sales & marketing all the way to fulfillment and service) and well beyond their own boundaries. They must connect digitally to their suppliers, partners, distributors, resellers, regulators and customers. Each of these have their “data fabrics” and applications which were never designed to connect, so with all the data-as-a-service and big data rhetoric, the application development community being asked to “work magic” in bringing them together.
Underutilization and the complexity of managing growing data sprawl is not new. But the urgency to address this is increasing dramatically during the last several years. Data-as-a-Service (DaaS) is seen as a big opportunity in improving IT efficiency and performance through centralization of resources. DaaS strategies have increased dramatically in the last few years with the maturation of technologies such as data virtualization, data integration, MDM, SOA, BPM and Platform-as-a-service.
The questions which are accelerating the Data-as-a-Service (DaaS) trend: How to deliver the right data to the right place at the right time? How to “virtualize” the data often trapped inside applications? How to support changing business requirements (analytics, reporting, and performance management) in spite of ever changing data volumes and complexity.
Big Data Fatigue and Company Shakeout?
 Big Data is the latest “next big thing” transforming all areas of business, but amid the hype, there remains confusion about what it all means and how to create business value.
Usually when there is so much hype…there is an inevitable boom-bust-boom cycle. Hence my question: Is the Big Data shakeout inevitable?
Are we in a big data tech bubble? If you are an enterprise customer, how do you prepare for this? What strategies do you adopt to take advantage of the situation? Can you move from lab experiments to production deployments with confidence?
The sheer number of companies that are chasing “the pot of big data gold” is astounding (see below). While the innovation has accelerated the ability of the typical Fortune 1000 enterprise to absorb and assimilate has not. They tend to be 5-10 years behind the curve. As a result, many big data startups are either running out of cash or they are being folded by VCs into other firms. This boom-bust cycle is a typical pattern in innovation.
http://www.bigdata-startups.com/open-source-tools/

Source: Big Data Universe v3.. Matt Turck, Sutian Dong & FirstMark Capital
The Case of Drawn to Scale
Drawn to Scale, the four year-old startup behind Spire, shut down recently. Co-founder and CEO Bradford Stephens announced the news in a blog post. Drawn to Scale raised .93M in seed funding.
Spire is a real-time database solution for HBase that lets data scientists query Hadoop clusters using SQL. According to Stephens, the system has been by deployed by American Express, Orange Flurry, and four other companies.
Drawn to Scale showed that its technology was viable in enterprise environments and established a “presence against competitors who raised 10-100x more cash,” but even that wasn’t enough to save the startup from its financial woes.
As Hadoop evolves and different layers of the data analytics stack get commoditized, specialized vendors like Drawn to Scale will have problems surviving. SQL-on-Hadoop was a unique feature set…but over time it has become a must-have feature, that is becoming embedded in the stack – e.g., Impala in Cloudera CDH stack. As a result, firms like Drawn to Scale once unique functionality becomes difficult to monetize.
Startup to Viable Ventures
The Big Data ecosystem is exploding with exciting start-ups, new divisions and new initiatives from established vendors. Everyone wants to be the vendor/platform of choice in assisting firms deal with the data deluge (Data growth curve: Terabytes -> Petabytes -> Exabytes -> Zettabytes -> Yottabytes -> Brontobytes -> Geopbytes), translate data to information to insight, etc.
In both U.S and Europe, several billion dollars of venture money has been invested in the past three years alone in over 300+ firms. Firms like Splunk had spectacular IPOs. Others like Cloudera and MapR have raised gobs of money. In the MongoDB space alone – a small market of less than 100M total revenue right now, over $2 Billion is said to have been invested in the past few years.
Innovation and Big Data: A Roadmap
 The bleeding edge of data and insight innovation is around next generation digital consumer experience. Consumer behaviors are rapidly evolving….always connected, always sharing, always aware. Obviously new technology like Big Data drives and transforms consumer behavior and empowerment.
With the influx of money, attention and entrepreneurial energy, there is a massive amount of innovation taking place to solve data centric problems (such as the high cost of collecting, cleaning, curating, analyzing, maintaining, predicting) in new ways.
There are two distinct patterns in data-centric innovation:
- Disruptive innovation like predictive search which brings a very different value proposition to tasks like discover, engage, explore and buy and/or creates new markets!!
- Sustaining innovation like mobile dashboards, visualization or data supply chain management which improves self service and performance of existing products and services.
With either pattern the managerial challenge is moving from big picture strategy to day-to-day execution. Execution of big data or data-driven decision making requires a multi-year evolving roadmap around toolset, skillset, dataset, and mindset.
Airline loyalty programs are a great example of multi-year evolving competitive roadmaps. Let’s look at BA’s Know Me project.
British Airways “Know Me” Project
British Airways (BA) has focused on competitiveness via customer insight. It has petabytes of customer information from its Executive Club loyalty program and its website. BA decided to put customer big data to work in its Know Me program. The goal of the program is to understand customers better than any other airline, and leverage customer insight accumulated across billions of touch points to work.
BA’s Know Me program is using data and applying it to customer decision points in following ways:
- Personal recognition—This involves recognizing customers for being loyal to BA, and expressing appreciation with targeted benefits and recognition activities
- Personalization — based on irregular disruptions like being stuck on a freeway due to an accident – A pre-emptive text message… We are sorry that you are missing your flight departure to Chicago. Would you like a seat on the next one at 5:15PM. Please reply Yes or No.
- Service excellence and recovery—BA will track the service it provides to its customers and aim to keep it at a high level. Given air travel constant problems and disruptions, BA wants to understand what problems its customers experience, and do its best to recover a positive overall result
- Offers that inspire and motivate—BA’s best customers are business travelers who don’t have time for irrelevant offers, so Know Me program analyzes customer data to construct relevant and targeted “next best offers” for their consideration.
The information to support these objectives is integrated across a variety of systems, and applied in real-time customer interactions at check-in locations and lounges. Even on BA planes, service personnel have iPads that display customer situations and authorized offers. Some aspects of the Know Me program have already been rolled out, while others are still under development.
The Need for New Data Roadmaps
New IT paradigms (cloud resident apps, mobile apps, multi-channel, always-on etc.) are creating more and more complex integration landscapes with live, “right-now” and real-time data. With data increasingly critical to business strategy, the problems of poor quality data, fragmentation, and lack of lineage are also taking center stage.
The big change taking place in the application landscape: application owners of the past expected to own their data. However, applications of the future will leverage data – a profound change that is driving the data-centric enterprise. The applications of the future need one “logical” place to go that provides the business view of the data to enable agile assembly.
Established and startup vendors are racing to fill this new information management void. The establish vendors are expanding on this current enterprise footprint by adding more features and capabilities. For example, the Oracle BI stack (hardware – databases – platform – prebuilt content) illustrates the data landscape changes taking place from hardware to mobile BI apps. Similar stack evolution is being followed by SAP AG, IBM, Teradata and others. The startup vendors typically are building around disruptive technology or niche point solutions.
To enable this future of information management, there are three clusters of “parallel” innovation waves: (1) technology/infrastructure centric; (2) business/problem centric; and (3) organizational innovation.
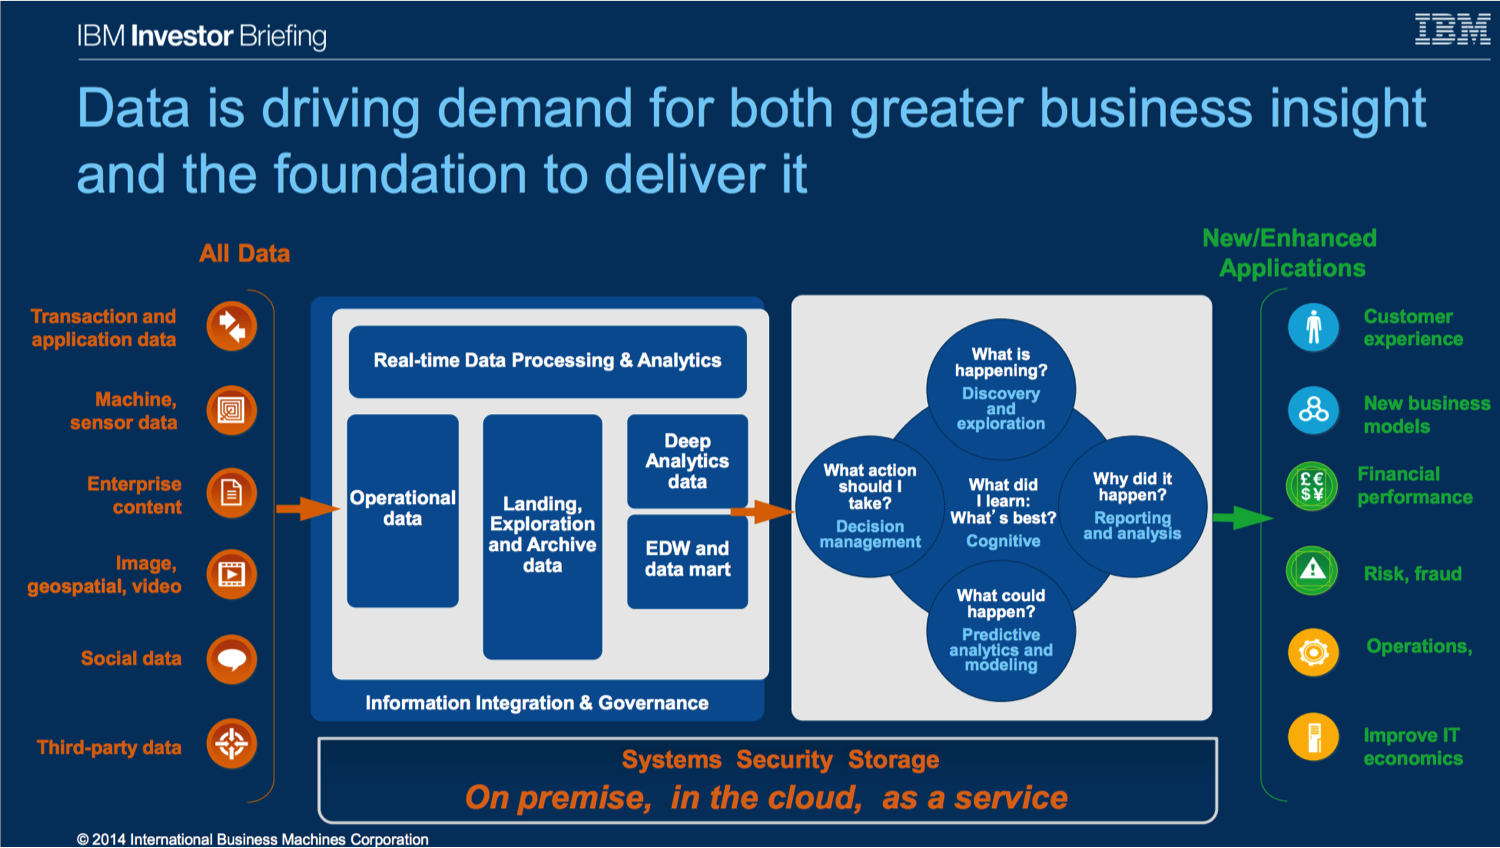
IBM summarize this wave of innovation in this Investor Day slide:
Data Infrastructure Innovation
- Data sources and integration — Where does the raw data come from?
- Data aggregation and virtualization- Where it stored and how is it retrieved?
- Clean high quality data — How does the raw data get processed in order to be useful?
Even in the technology/infrastructure centric side there are multiple paths of disruptive innovation that are taking along different technology stacks shown below.
Proctor & Gamble – Business Sphere and Decision Cockpits
![]()
Data-driven DNA is about having the right toolset, mindset, skillset and dataset to evolve a major brand and seize today’s omni-channel opportunities. Whether it’s retooling and retraining for the multiscreen attention economy, or introducing digital innovations that transform both retail and healthcare, P&G is bringing data into every part of its core strategies to fight for the customer.
—————————
Striving for market leadership in consumer products is a non-stop managerial quest. In the struggle for survival, the fittest win out at the expense of their rivals because they succeed in adapting themselves best to their environment.
CMOs and CIOs everywhere agree that analytics is essential to sales & marketing and that its primary purpose is to gain access to customer insight and intelligence along the market funnel – awareness, consideration, preference, purchase and loyalty.
In this posting we illustrate a best-in-class “run-the-business” with Data/Analytics Case Study at P&G. The case study demonstrates four key characteristics of data market leaders:
- A shared belief that data is a core asset that can be used to enhance operations, customer service, marketing and strategy
- More effective leverage of more data – corporate, product, channel, and customer – for faster results
-
Technology is only a tool, it is not the answer..!
- Support for analytics by senior managers who embrace new ideas and are willing to shift power and resources to those who make data-driven decisions
This case study of a novel construct called Business Cockpit (also called LaunchTower in the Biotech and Pharmaceutical Industry) illustrates the way Business Analytics is becoming more central in retail and CPG decision making.
Here is a quick summary of P&G Analytics program:
- Primary focus on improving management decisions at scale – did the analysis to identify time gap between information and application to decision making
- “Information and Decision Solutions” (IT) embeds over 300 analysts in leadership teams
- Over 50 “Business Suites” for executive information viewing and decision-making
- “Decision cockpits” on 50,000 desktops
- 35% of marketing budget on digital
- Real-time social media sentiment analysis for “Consumer Pulse”
- Focused on how to best apply and visualize information instead of discussion/debate about validity of data


P&G Overview
Data Scientist Infographic & Managed Analytics

The exploding demand for analytics professionals has exceeded all expectations, and is driven by the Big Data tidal wave. Big data is a term commonly applied to large data sets where volume, variety, velocity, or multi-structured data complexity are beyond the ability of commonly used software tools to efficiently capture, manage, and process.
To get value from big data, ‘quants’ or data scientists are becoming analytic innovators who create tremendous business value within an organization, quickly exploring and uncovering game-changing insights from vast volumes of data, as opposed to merely accessing transactional data for operational reporting.
This EMC infographic summarizing their Data Scientist study supports my hypothesis – Data is becoming new oil and we need a new category of professionals to handle the downstream and upstream aspects of drilling, refining and distribution. Data is one of the most valuable assets within an organization. With business process automation, the amount of data being generated, stored and analyzed by organizations is exploding.
Following up on our previous blog post – Are you one of these — Data Scientist, Analytics Guru, Math Geek or Quant Jock? — I am convinced that future jobs are going to be centered around “Raw Data -> Aggregate Data -> Intelligence ->Insight -> Decisions” data chain. We are simply industrializing the chain as machines/automation takes over the lower end of the spectrum. Also Web 2.0 and Social Media are creating an interesting data feedback loop – users contribute to the products they use via likes, comments, etc.
CIOs are faced with the daunting task of unlocking the value of their data efficiently in the time-frame required to make accurate decisions. To support the CIOs, companies like IBM are attempting to become a one-stop shop by a rapid-fire $14 Bln plus acquisition strategy: Cognos, Netezza, SPSS, ILog, Solid, CoreMetrics, Algorithmics, Unica, Datacap, OpenPages, Clarity Systems, Emptoris, DemandTec (for retail). IBM also has other information management assets like Ascential, Filenet, Watson, DB2 etc. They are building a formidable ecosystem around data. They see this as a $20Bln per year opportunity in managing the data, understanding the data and then acting on the data. Read more 
Is Your BI Project in Trouble?
 Enterprise Business Intelligence (BI) project failure can happen for a variety of reasons. Sometimes it’s due to frequent scope changes with a fixed schedule constraint, unexpected and unplanned-for “must-have” requirements changes, loss of key team members onshore or offshore, chronic effort under-estimation, lack of proper work breakdown structure, lack of QA, and so on.
Regardless of the causes, BI, Analytics, performance management failed projects waste billions of dollars (and hours) each year.
Over the years, I have seen a lot of well-intentioned custom development, commercial, off-the-shelf package customization – SAP, Oracle, Peoplesoft ERP, CRM, SCM – and other enterprise data-warehouse projects get into trouble for a variety of reasons. Troubled projects usually need triage, recovery, and turn-around skills to straighten things out quickly.
I am afraid that BI and Corporate Performance Management is reaching a phase in its hype cycle where we are beginning to see growing demand for troubled project recovery. It doesn’t take genius to realize that BI/Analytics project demand is growing as it is one of few remaining IT initiatives that can make companies more competitive. However, demand doesn’t imply project success. Read more
The Curious Case of Salesforce and Workday: Data Integration in the Cloud
 The growing enterprise adoption of Salesforce SFA/CRM, Workday HR, Netsuite ERP, Oracle on Demand, Force.com for apps and Amazon Web Services for e-commerce will result in more fragmented enterprise data scattered across the cloud.
Automating the moving, monitoring, securing and synchronization of data is no longer a “nice-to-have” but “must-have” capability.
Data quality and integration issues — aggregating data from the myriad sources and services within an organization — are CIOs and IT Architects top concern about SaaS and the main reason they hesitate to adopt it (Data security is another concern). They have seen this hosted data silo and data jungle problem too many times in the past. They know how this movie is likely to unfold.
Developing strategic (data governance), tactical (consistent data integration requirements) or operational (vendor selection) strategies to deal with this emerging “internal-to-cloud” data quality problem is a growing priority in my humble opinion. Otherwise most enterprises are going to get less than optimal value from various SaaS solutions. Things are likely to get out of control pretty quickly. Read more
Do your KPIs Reflect Business Insights?
Obsolete KPIs can be Lethal
In the Aesopian fable of the one-eyed stag, a deer overcomes his visual handicap by grazing on a cliff near the sea with his good eye facing the land. Since all his known dangers were on land, this keeps him safe from predators for a very long time – until he is killed by a hunter in a boat.
The relevance of our KPIs can make or break our business. KPIs are often defined as static metrics for an enterprise and can easily become outdated. Economic uncertainty and competitive pressures are prompting questions on the validity of KPIs and performance management processes. To stay competitive requires a process of continually validating metrics with the business environment.
Another common challlenge with KPIs is that there are too many of them. Modern technology has gven us the ability to measure a very large number of parameters in the business. Some of these are more relevant than others. Jack Welch is known to have said, ”Too often we measure everything and understand nothing”. Monitoring some metrics and ignoring others are decisions we make based on our business perspective.
Relevance Enabled by Process
How do you decide on which KPI’s are most relevant to success? An often overlloked first step is to understand that primary business goals before looking at the technology solution. Avinash Kaushik defines KPIs simply as “Measures that help you understand how you are doing against your objectives”. This fundamental aproach is a good way of weeding out items which are not relevant to what we want as a business and avoid adverse surprises. At a more deeper level, building a robust Business Analytics solution requires answers to questions such as:
1. What events have the greatest impact on the busiens and how are they measured?
2. How often do you validate that you are measuring the right parameters ?
3. What instrumentation do you need to create the right dashbords for your KPI’s ? Can this instrumentation be updatd as teh KPIs change?
4. What is the process for collecting, synthesizing, manipulating and presenting the data to represent thsese metrics? How does the process change when if the metric change?
5. What technologies and architecture are necessary to support those decision-making patterns? Is there need for a “single source of truth” or a federated model possible?
Centers of Excellence
Needless to say, this approach requires a tight inegration between the business owners and IT acrchitects. A recent study by Gartner says that ”IT collaboration initiatives fail because IT leaders hold mistaken assumptions about basic issues…..rather than making technology the starting point, IT leaders should first identify real business problems and key performance indicators (KPIs) that link to business goals.”
Many business executives believe that IT is unable to deliver results where it counts. At the same time, IT organizations spend an incredible amount of time, money and resources simply reporting obvious data within their business process and workflows.
An organizational solution to this problem is the creation of a Competency Center or Center of Excellence (CoE) with representation from from both business and IT and shared objectives. The CoE defines the blueprint for implementing BI, Performance Management and Analytics aligend with KPIs. Some of the obvious benefits include:
- Cost savings from eliminating Silos
- Better collaboration between Business and IT
- Joint ownership of corporate objectives
There are other aspects of the CoE which make it a practical approach to creating an effective vehicle for deploying analytics solutions. The sheer volume and texture of busienss data is much more complicated than it has ever been in modern busienss history. The world’s data doubles every two years creating more opportunities for analyses. Understanding this data even at an aggregate level requires a business perspective combined with technological expertise. Furthernore, understanding technologies such as Big Data for unstrcutured data analysis requires business leaders and IT eimplementors to work together.
The CoE is the ideal structire to implement a Business Perspective Solution. A well implemented Business Perspective Solution takes into account the key objectives of the busienss, leverages sophisticated analytics technologies and focuses on sustainable processes to support decision making in an organization.
Superior decisions based on business perspective separate winners from losers.
Are your KPIs in sync with your business perspectives? Please share your comments below.
Further Reading
1. Six Web Metrics / Key Performance Indicators To Die For by Avinash Kaushik, Occam’s Razor
2. Practical BI – What CEOs want from BI and Analytics by Ravi Kalakota, Business Analytics 3.0
3. The Stupidity of KPIs in Business Analytics by Mark Smith, Ventana Reasearch
Executing a BI and Analytics CoE
 Most Organizations are Data Rich and Information Poor
——————————
Data overload is becoming a huge challenge for businesses and a headache for decision makers. Public and private sector corporations are drowning in data — from sales, transactions, pricing, supply chains, discounts, product, customer process, projects, RFID smart tags, tracking of shipments, as well as e-mail, Web traffic and social media.
I see this data problem getting worse. Enterprise software, Web and mobile technologies are more than doubling the quantity of business data every year, and the pace is quickening. But the data/information tsunami is also an enormous opportunity if and only if tamed by the right organization structure, processes, people and platforms.
A BI CoE (also called BI Shared Services or BI Competency Centers) is all about enabling this disciplined transformation along the information value chain: “Raw Data -> Aggregated Data -> Intelligence -> Insights -> Decisions -> Operational Impact -> Financial Outcomes -> Value creation.” A BI CoE can improve operating efficiencies by eliminating duplication and streamlining processes.
In this posting we are going to look at several aspects of executing a BI CoE:
- What does a BI CoE need to do?
- Insource or Outsourcing the BI CoE
- Why do BI CoE’s Fail?
- BI CoE Implementation Checklist
