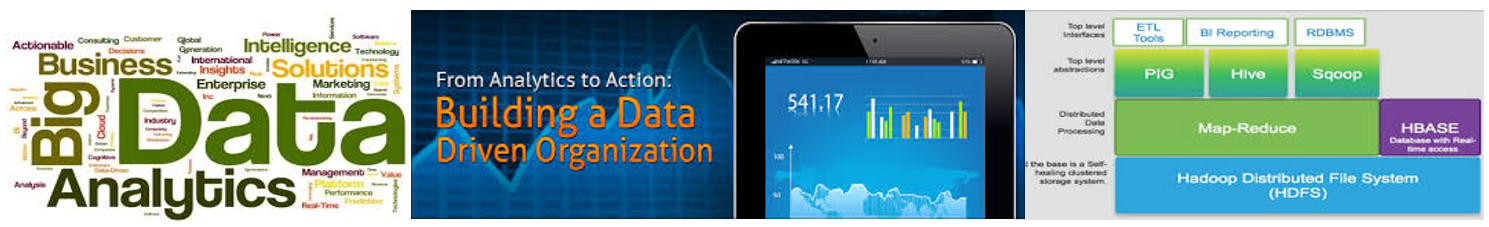


Consumerization of BI: Data Visualization Competency Center
 What do users want? Self-service, interactive analytics with all kinds of datasets with instant response times, no waiting.
Today there is a strong move towards “Consumerization of BI” as business users are demand the same speed, and ease of use from their enterprise applications as their at-home software.
Consumerization of BI (“data at your fingertips”) means:
- Help employees see and understand data
- Helping employees gain insight into their data using simple drag-and-drop operations to solve business problems
- Ability to quickly change filters and query conditions and conduct top down analysis via drill down
- Make analytics fast, easy, interactive, and most importantly – useful
In every major corporation there is a renewed push to industrialize and improve data visualization and reporting capabilities.
The challenge is not in procuring the next greatest tool or platform but how to organize the people, process and assets effectively to create value, reduce training and support costs. In other words, how to facilitate and create a flexible operating model for data mining and visualization delivery that provides discipline at the core while giving the business the agility that they need to make decisions or meet client needs?
Decision making is a core business activity that requires facts and insights. Slow, rigid systems are no longer useful enough for sales, marketing and other business users or even IT teams that support them. Competitive pressures and new sources of data are creating new requirements. Users are demanding the ability to answer their questions quickly and easily.
So the new target state is to empower business users along the Discover, Decide and Do lifecycle:
- Discover new insights by rapidly accessing and interrogating data in ways that fit how people naturally think and ask questions.
- Decide on best actions by publishing dashboards, collaborating with others, discussing insights and persuading others through data presented in an interactive application (“app”) rather than in a static view.
- Do what is best at each decision point with confidence, based on the consensus that develops when new data is aggregated and explored with multiple associations and different points of view. Teams can take action more rapidly and move projects forward more effectively when everyone understands the data underlying decisions.
The challenge for business users is data discovery and ease-of-use. They want to focus on business questions that require aggregation and visualization. They want the interactive ability to quickly change filters and query conditions.
The challenge for infrastructure and application teams in every corporation is to deliver new easy-to-use platforms to their business partners quickly and consistently while maintaining governance and control.
To meet both sets of requirements, best practice firms are creating Data Mining and Visualization Competency Center or Centers of Excellence (DV-CoE) to ensure that the people, process and technology investments are not duplicated and addressed in a way that maximizes ROI and enhances IT-Business partnership. I have seen many cases where not having a proper structure leads to redundant projects and sub-optimal results. Read more 
Data Visualization, Discovery and Visual Analytics – Use Cases, Tools, CoE, Vendors
 “Numerical quantities focus on expected values, graphical summaries on unexpected values.” – John Tukey, Exploratory Data Analysis, 1977.
Decision support needs better visualization. Scorecards, Dashboards, Heatmaps, Alerts, Management Reporting, Operations and Transactions Reporting are all enterprise example of data visualization outputs.
Some data visualization examples include:
- Data Scientist — uses “R”, a programming language used for statistical modeling, to understand traffic flows and congestion patterns and advise on options to improve travel times for Amazon.com Local delivery drivers.
- Pharmaceutical Sales Representative — uses QlikView on an iPad to access current industry sales trends and doctor prescription history while on a sales call with a busy physician.
- Healthcare Chief Medical Officer — uses Tableau Software to analyze all aspects of hospital performance including population management, emergency room effectiveness and Affordable Care Act compliance.
- Crime Analyst— uses Microstrategy to maintain a consolidated view of crime levels and optimize staffing allocations to dispatch police into high crime areas.
- Retail Store Manager — uses QlikView to analyze which products are selling best which impacts store assortments and which products get featured vs which ones get discontinued.
- Telecom Customer Service Agent — uses Spotfire to monitor call center statistics and how it translates into customer satisfaction and retention.

Data Monetization: Turning Data into $$$
 The billion dollar question facing executives everywhere:
- How do I monetize my data? How do we turn data into dollars?
- What small data or big data monetization strategies should I adopt?
- Which analytical investments and strategies really increase revenue?
- What pilots should I run to test data monetization ideas out?
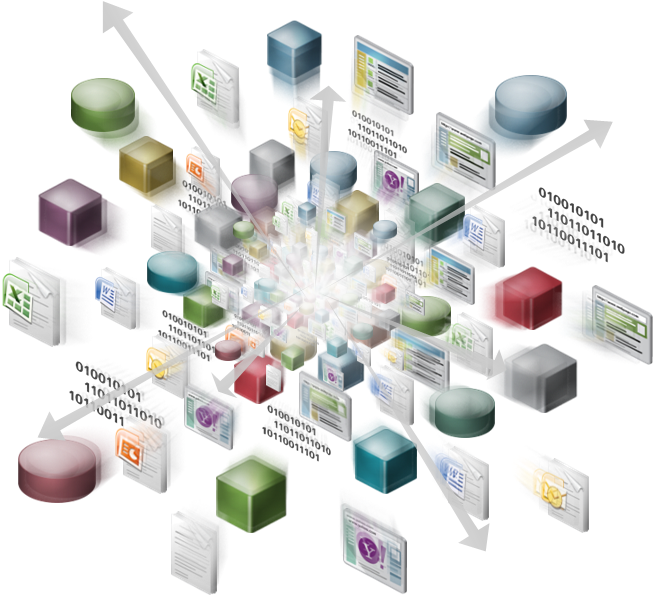
Data Monetization is the process of converting data (raw data or aggregate data) into something useful and valuable – help make decisions (such as predictive maintenance) based on multiple sources of insight. Data monetization creates opportunities for organizations with significant data volume to leverage untapped or under-tapped information and create new sources of revenue (e.g., cross-sell and upsell lift; or prevention of equipment breakdowns).
But, data monetization requires a new IT clock-speed that most firms are struggling with. Aberdeen Research found that the average time it takes for IT to complete BI support requests, with traditional BI software, is 8 days to add a column to a report and 30 days to build a new dashboard. For an individual information worker trying to find an answer, make a decision, or solve a problem, this is simply untenable. For an organization that is trying to differentiate itself on information innovation or data-driven decision making, it is a major barrier to strategy execution.
To speed up insight generation and decision making (all elements of data monetization) business users are bypassing IT and investing in data visualization (Tableau) or data discovery platforms (Qlikview). These platforms help users ask and answer their own stream of questions and follow their own path to insight. Unlike traditional BI that provides dashboards, heatmaps and canned reports, these tools provide a discovery platform rather than a pre-determined path.
Also companies like Marketo which create marketing automation software are getting into the customer engagement and data monetization game. Their focus is to enable marketing professionals find more future customers; to build, sustain, and grow relationships with those buyers over time; and to cope with the sheer pace and complexity of engaging with customers in real time across the web, email, social media, online and offline events, video, e-commerce storefronts, mobile devices and a variety of other channels. And in many companies, marketing knits these digital interactions together across multiple disconnected systems. The ability to interact seamlessly with customers across multiple fast-moving digital channels requires an engagement strategy enabled by data and analytic insights.
