


Data/BI/Analytics Evolution @ NetFlix
More data + Better models + More accurate metrics + Better approaches & architectures = Lots of room for improvement!
 It’s amazing to watch how quickly the data engineering / analytics/ reporting/ modeling/ visualization toolset is evolving in the BI ecosytem.
There are clearly massive foundational shifts taking place around big data. I am not sure how large conventional Fortune 500 firms can innovate and keep up with what’s going on. I have run into CIOs who have not heard of Hadoop in some cases.
It’s also fascinating to see how data-driven “bleeding” edge firms like NetFlix are pushing the envelope. Netflix stats are amazing: 1/3+ Internet traffic (NA / peak); 100+ Million hours per day; 65+ Million members / 50+ countries; 500 Billion Events / Day.
NetFlix is clearly reinventing Television and targeting 90 million potential subs in the US market alone. Binge-watching, cord-cutting are now part of our everyday lingo. What most people don’t realize is how data-driven Netflix is…. from “giving viewers what they want” to “leveraging data mining to boost subscriber base”.
Viewing -> Improved Personalization -> Better Experience is the virtuous circle.
Here is a glimpse at how their BI landscape has evolved in the past five years as they integrate 5 million to 6 million net adds for several years now. The figures are from a presentation by Blake Irvine, Manager Data Science and Engineering.
BI tools @ NetFlix pre-Hadoop

ETL -> Data Warehouse -> BI platform for reporting is currently the mainstream model in most firms. This is typically the state of the art in most large enterprises.
The basic objective is analyze subscriber data and viewing data…. Who, What, When, Where, How Long.
BI tools incorporating Hadoop
It seems that Netflix has reached a tipping point in “analytics.” I believe that some companies like Netflix execute better because they have a better foundation around the value chain: “Raw Data -> Aggregated Data -> Intelligence -> Insights -> Decisions -> Operational Impact -> Financial Outcomes -> Value creation.”

What is the catalyst for this shift? Complaints about slowness, dealing with data volumes/variety, and the dependence on IT for incorporating changes, has made it necessary for business users to adopt new analysis and reporting tools.
This architecture change also allows for multiple ways of interacting with data, including interactive structured query language, or SQL, real-time processing and online data processing, along with its traditional batch data processing. Hadoop gives the ability to keep all data together for shared use and analysis. Apache Hive and Presto are used for running ad-hoc, lightweight aggregation and interactive analytic queries against Hadoop data sources.
Just to give you a sense of what the bleeding edge firms are doing with Hadoop. At Hadoop Summit 2015, Twitter in their presentation claims to have 300+ petabytes in their Hadoop cluster. They also have multiple 1000+ machine Hadoop clusters. Hadoop clusters combine commodity servers with local storage and an open source software distribution to create a reliable distributed compute and storage platform for large data sets scalable up to petabytes, or PBs, with thousands of servers or nodes.
Post Hadoop – The Future
The future increasingly seems to have some variant of Spark complementing Hadoop. Applying machine learning to Big Data in Hadoop is something firms like NetFlix are moving to clearly. This means grabbing data, analyzing it, creating a model and using it for predictions.

[Presto is an open source distributed SQL engine for running interactive queries against large datasets.]
The future around process seems to incorporate Spark. Spark is an in-memory analytics replacement for iterative computation frameworks like MapReduce; both employ massively parallel compute and then shuffle interim results, with the difference being that Spark caches in memory while MapReduce writes to disk. Spark offers a simpler programming model, better fault tolerance, and is considered more extensible than MapReduce. Spark is any form of iterative computation, and it was designed to support specific extensions; among the most popular are machine learning, microbatch stream processing, and graph computing.
By contrast, Hadoop is a data platform. It is one of many that can run Spark, because Spark is platform-independent. So you could also run Spark on Cassandra, other NoSQL data store, or SQL databases, but Hadoop has been the most popular target right now.
However, the toolset by itself is not enough if you don’t have a culture of analytics. Blake Irvine said their cultural values are:
- High Performance
- Freedom & Responsibility
- Context
- Highly Aligned, Loosely Coupled
Makes sense. Being a data leader requires a mix of cultural bias, team structure, innovative tools and leadership to make it happen.
Netflix future According Reed Hastings
Analyst question: From a product standpoint, you obviously refreshed the interface for laptops and PC. What are the big things you are thinking about? Where do you go from here in terms of product priorities as you move into 2016?
Reed Hastings – Netflix, Inc. – CEO — “with a massive move from linear programming on to the Internet…. The core is really continuing to improve the personalization.
Being able to more and more accurately present content on the screen whether that’s a TV screen or phone screen that a consumer is just very motivated to click on and watch.
We’ve seen tremendous benefit as we’ve done more and more of the big data work.
In addition on the user interface, we’re always working on performance, usability, testing new ideas. And we’ve got some pretty cool stuff in the lab with multi-video streams on the television screen. We see if it tests well. I’m pretty optimistic about it. There is a ton to learn as smart TVs get better and faster, as adapters like Chromecast get better. There’s a lot of innovation on the hardware side that we are taking advantage of.”
More detailed Netflix stack and BI architecture.

Additional Notes and References
- Netflix metrics… subscribers 65+ Million; 50+ countries; >2 bln hours watched each month
- Entry-level plan in the US is actually $7.99 for standard-def one-stream plan
- Netflix has two things that are working . One, launching new shows that have become great brands on their own. But also as these shows grow into their second and third and fourth seasons, they’re actually more attractive on their own. So adding more breadth of content, more original series, and those series have become bigger and bigger brands that become subscriber events as they grow.
- Analyzing viewing data…. Who, What, When, Where, How Long…. Since 2008, Netflix streaming has expanded from thousands of customers watching occasionally, to millions of customers watching billions of hours every month. Each time a customer views, Netflix gathers events describing that view – both user-driven events like pause and resume, fast forward and rewind, and device-driven events like network throughput traces and video quality selections. To organize, understand, and create value out of these events, Netflix has built a data architecture to process all these events.
- Hadoop has crossed the chasm, to use Geoffrey Moore’s term, from early adopters to mainstream adopters. Every major corporation is building some variant of a Hadoop Managed Services (HMS) platform as a service.
- According to a study conducted by Allied Market research, the Hadoop market is expected to grow from $2B in 2013 to more than $50B by 2020 with a CAGR of 58.2 percent over that time.
- Spark was originally developed at UC Berkeley in 2009. Databricks is the firm commercializing Spark. Spark was initially designed for interactive queries and iterative algorithms, as these were two major use cases not well served by batch frameworks like MapReduce. Consequently Spark excels in scenarios that require fast performance, such as iterative processing, interactive querying, large-scale batch computations, streaming, and graph computations.
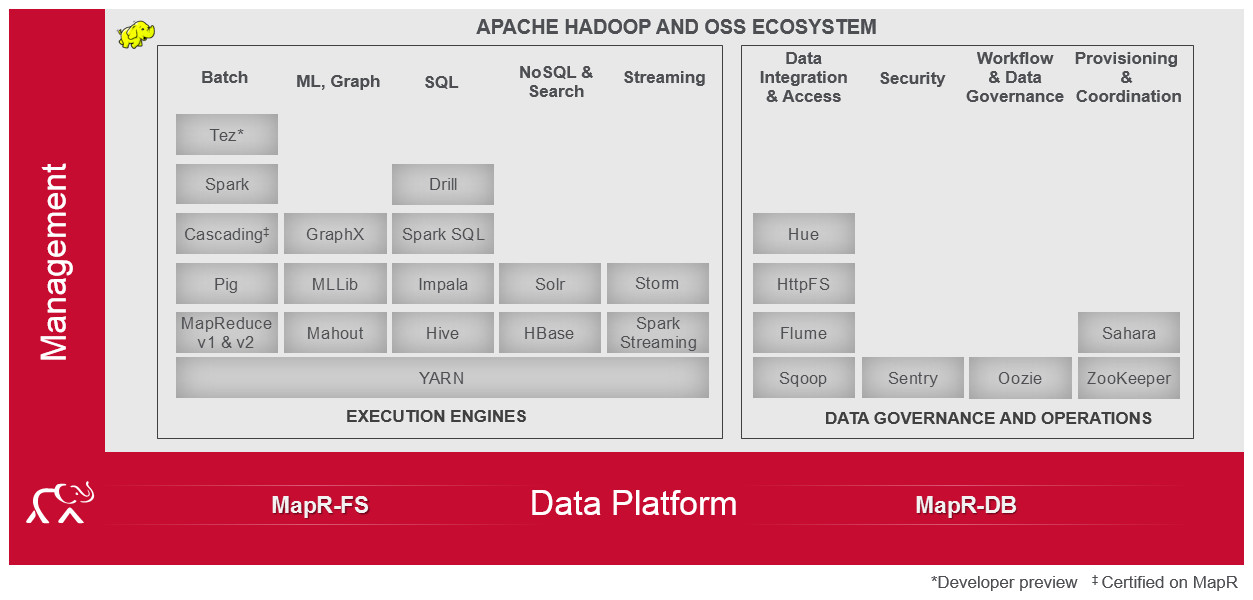
- Interesting figure from MapR that helped me understand the Apache Hadoop project chaos…

Trackbacks & Pingbacks