


Organizing for BI, Analytics and Big Data: CoE, Federated or Departmental
- Data-as-a-Service: Data Provisioning, Management, Lineage, Quality
- Reporting-as-a-Service: Dashboards, KPIs, Drilldowns/Aggregates…. Descriptive
- Analytics-as-a-Service: Predictive Modeling and BI… Prescriptive analytics
- Information-as-a-Service: Threshold based Alerts, Exceptions, Mobile Prompts
- Insights-as-a-Service: ML/AI based…automated learning – ambient intelligence, Next best Offer/Action
Which strategy are you implementing?

Data is valuable. Data is plentiful. Data is complex. Data is in flux. Data is fast moving. Capturing and managing data is challenging.
So, if you are a senior leader in a Fortune 2000 company. How do you structure your group to deliver effective BI, Analytics or Big Data projects? Do you have the right structure, toolset, dataset, skillset and mindset for analytics and Big Data?
Organizing for effective BI, Analytics and Big Data is becoming a hot topic in corporations. In 2012, business users are exerting significant influence over BI, Analytics and Big Data decisions, often choosing analytics and visualization platforms and products in addition to/as alternatives to traditional BI platform (reporting and visualization tools).
An avalanche of new use cases, content types and interaction models expands the scope for tomorrow’s BI initiatives.
Framing the Operating Model Issue
What are the biggest obstacles that you have to overcome to go from data-flooded to data-driven or data-informed?
No one can dispute the importance of BI and Analytics in corporations. BI and Analytics rank consistently in the top 2 priorities for CIO and business leaders in every survey. See this top 10 CIO Business and Technology Priorities in 2012 (Source: Gartner). IBM and Bloomberg had a similar priority list.
So if BI, Analytics and Big Data are among your top priorities, do you have the right org structure, people, processes, governance to get stuff done?
| Top 10 Business Priorities | Ranking | Top 10 CIO Technology Priorities |
| Increasing enterprise growth | 1 | Analytics and business intelligence |
| Attracting and retaining new customers | 2 | Mobile technologies |
| Reducing enterprise costs | 3 | Cloud computing (SaaS, IaaS, PaaS) |
| Creating new products and services (innovation) | 4 | Collaboration technologies (workflow) |
| Delivering operational results | 5 | Virtualization |
| Improving efficiency | 6 | Legacy Modernization |
| Improving profitability (margins) | 7 | IT Management and Cost Takeout |
| Attracting and retaining the workforce | 8 | CRM |
| Improving marketing and sales effectiveness | 9 | ERP Applications |
| Expanding into new markets and geographies | 10 | Security |
What is the best organization structure to exploit information for a strategic advantage?
 Everyone is talking about becoming a real-time “fact-based decision-making organization.” How do you get there?
To make good decisions, the average business analyst needs data from all over the place: the data warehouse, but also the Web, big data, production systems, as well as via partners and vendors. In fact, the typical analyst spends more than 50% of the time chasing data, which slows delivery of analytic insights and limits the time available for thorough analysis. Some practitioners refer to this conundrum as “the data problem.”
Increasingly, organizations are realizing that there is more to information management and business analytics than simply implementing technology like Hadoop, Oracle Exadata, SAP HANA, SAS/Teradata or IBM BigInsights.
Business leaders realize the significant value of managing their information and applying analytics to turn information into a competitive and strategic asset to drive their business forward.
With many competing priorities and perspectives, firms are focusing on internal alignment to ensure efficiency and to maintain the right balance between tactical and strategic objectives. To achieve this level of BI and Analytics maturity, there is a need for a comprehensive and strategic approach to leverage technology as well as people, processes and organizational culture.
In my previous blog posting, BI/Analytics Center of Excellence (CoE) I wrote in great detail why you need a CoE structure and what goes into this. In a subsequent posting, Executing a BI/Analytics CoE I wrote about what it takes to execute a CoE.
Here I am going to get into how to organize for Big Data and Analytics which will increasing become a key issue for management. Also talk about the complexity of BI platforms and landscape. Most people are enamored by Big Data. They are losing sight of the fact that they have barely scratched the surface of what their BI platforms from SAP, oracle, SAS, IBM or Microsoft can do today. Also if executed right, these BI platforms can act as a gateway to Big Data intiatives. Otherwise we will end up with more silo’s and fragmentation.
Functional Areas for every Big Data Program
 My first suggestion to organizations is don’t treat Big Data as something unique.
Align it with your BI program or existing BI Center of Excellence (BI CoE). Data is data. This enable you to drive an overarching charter that promotes the optimal use of business intelligence across the organization. A BI CoE focus could include data integration, data stewardship, delivery of information and analytical services, and vendor relationships.
Every enterprise BI, Analytics or Big Data CoE needs to cover some of these functional areas:
- Program Management: Coordination of all information management and analytics efforts.
- Data Stewardship & Governance: Implementation and support for enterprise data governance effort.
- Internal Processes: Coordination and interaction between internal groups and functions.
- Platform Technologies Support and standardization of enterprise technologies.
- Enterprise Information Management: Coordination and support for enterprise data integration, quality, virtualization and management.
- Information Delivery: Using information and analytics to support business requirements.
 The scope of the CoE covers several strategic and tactical areas within your organization. The specific focus areas or functions are determined during an assessment phase. This assessment is the first phase of establishing a CoE, and it is during this phase that a detailed examination of your organization’s environment takes place. The assessment outcome produces the initial focus of the CoE, including required skills, functions, and responsibilities, as well as a funding model. Funding is always the key thing in corporations…who pays gets to control what gets done.
Getting the Big Data Platforms Right
 The carpenter is only as good as the tools. Similarly, the BI user needs to have the right plumbing in place to be effective.
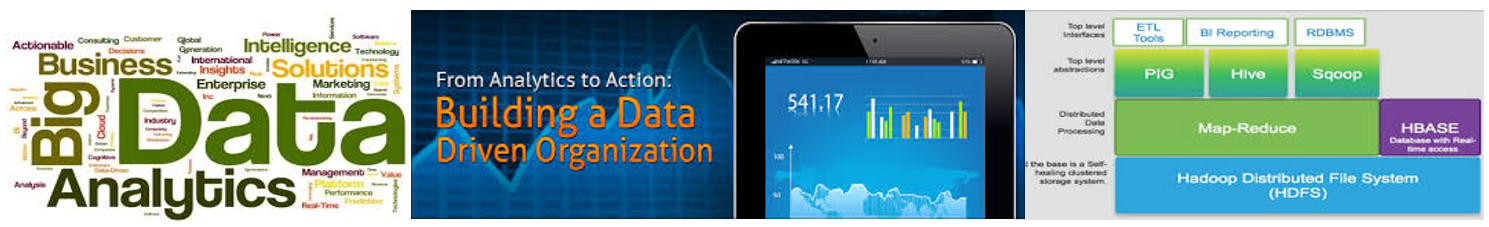
However as you can see from the stack figure (source: Forrester), the landscape is pretty complicated. Most global firms are dealing with complexity.
BI platforms, the plumbing, essentially enable all types of users — from IT staff to consultants to business users — to integrate data and build applications.
A Big Data platform is really an evolution of the BI software platform that delivers the capabilities listed below. These capabilities are organized into four categories of functionality: integration, data movement, information delivery and analysis. [Note: this is a mashup from a variety of sources and might not be MECE -mutually exclusive and collectively exhaustive].
Data movement and Information delivery are becoming significant pain-points for companies. We can generate insight but can’t link it to execution then we have a problem.
Right now Analytics is the core focus of most big data projects today, but we are seeing an increased interest in deployments of analytics to discover new insights, and in integration and information delivery to implement those insights.
Analytics, Analysis and Reporting
- Online analytical processing (OLAP) — This enables end users to analyze data with extremely fast query and calculation performance, enabling a style of analysis known as “slicing and dicing.” Users are able to easily navigate multidimensional drill paths. And they have the ability to write-back values to a proprietary database for planning and “what if” modeling purposes. This capability could span a variety of data architectures (such as relational or multidimensional e.g., NOSQL) and architectures (such as disk-based or in-memory like SAP HANA).
- Interactive visualization — This gives users the ability to display numerous aspects of the data more efficiently by using interactive pictures and charts, instead of rows and columns. Over time, advanced visualization (e.g., Tableau Software) will go beyond just slicing and dicing data to include more process-driven BI projects, allowing all stakeholders to better understand the workflow through a visual representation.
- Predictive modeling and data mining — This capability enables organizations to classify categorical variables and to estimate continuous variables using advanced mathematical techniques. BI developers are able to integrate models easily into BI reports, dashboards and analysis, and business processes. Oracle OBIEE is moving in this direction.
- Heatmaps & Scorecards — These take the metrics displayed in a dashboard a step further by applying them to a strategy map that aligns key performance indicators (KPIs) with a strategic objective. Scorecard metrics should be linked to related reports and information in order to do further analysis.
Core Platform Capabilities and Integration
- Core Infrastructure Capabilities — All applications and tools use the same security, metadata, administration, portal integration, object model and query engine, and should share the same look and feel.
- Metadata management — Not only should all applications and tools leverage the same metadata, but the offering should provide a robust way to search, capture, store, reuse and publish metadata objects such as dimensions, hierarchies, measures, performance metrics and report layout objects.
- Development tools — The platform should provide a set of programmatic development tools and a visual development environment, coupled with a software developer’s kit for creating BI applications, integrating them into a business process, and/or embedding them in another application.
- Social Collaboration — This capability enables users to share and discuss information, content and results, and/or manage hierarchies and metrics via discussion threads, chat and annotations, either embedded in the platform or through integration with collaboration, social software and analytical master data management (MDM).
- Master data management. MDM’s objective is to enable that elusive single trusted view of critical master data (customer, product, employee, location, security, etc.) across complex organizations in order to optimize the business-critical processes, decisions, and interactions that rely on that data.
Data Migration, Replication and Movement
Data movement is critical in any organization to support data management initiatives, such as data warehousing (DW), business intelligence (BI), application migrations and upgrades, master data management (MDM), and other initiatives that focus on data integration. Besides moving data, ETL supports complex transformations like cleansing, reformatting, aggregating, and converting very large volumes of data from many sources.
Although ETL is used extensively to support traditional scheduled batch data feeds into DW and BI environments, the scope of ETL has evolved over the past five years to support new and emerging data management initiatives, including:
- Data virtualization. Moving data from multiple repositories like databases and data warehouses to a virtualized data services layer is a critical component of any data virtualization initiative. Because ETL is a proven, mature technology for moving, transforming, and loading very large amounts of data quickly, many data virtualization solutions continue to leverage it. In addition, ETL’s strong capability to integrate with many heterogeneous sources — including mainframes, distributed databases, and different database types — and support complex transformations makes it essential for any data virtualization initiative.
- Big data Movement. Big data is all about processing and analyzing very large amounts of structured, unstructured, or semistructured data very quickly. Although Hadoop offers a scalable data platform to process very large amounts of data for analytics purposes, getting data into the Hadoop platform is often not easy. Most leading ETL vendors are extending their solutions to integrate with Hadoop to offload large amounts of data from databases and data warehouses.
- Cloud integration. Today, more enterprises are considering options to store data in the public cloud to lower IT costs, improve collaboration, and support new applications like mobile and department-specific apps. ETL is extending its capability to integrate on-premises data with these public and private clouds, offering a powerful platform for seamless integration. ETL solutions can be configured to support variable data loading and unloading frequencies and ensure transactional integrity and security.
ETL capabilities increasingly are overlapping with other products in adjacent markets, such as enterprise information integration (EII), enterprise application integration (EAI), replication, enterprise service bus (ESB), and data virtualization.
Information Delivery and Visualization
 Reporting — Reporting provides the ability to create formatted and interactive reports, with or without parameters, with highly scalable distribution and scheduling capabilities. In addition, BI platform vendors should handle a wide array of reporting styles (for example, financial, operational and performance dashboards), and should enable users to access and fully interact with BI content delivered consistently across delivery platforms including the Web, mobile devices and common portal environments.

- Dashboards — This subset of reporting includes the ability to publish formal, Web-based or mobile reports with intuitive interactive displays of information, including dials, gauges, sliders, check boxes and traffic lights. These displays indicate the state of the performance metric compared with a goal or target value. Increasingly, dashboards are used to disseminate real-time data from operational applications or in conjunction with a complex event processing engine.
- Ad hoc query — This capability enables users to ask their own questions of the data, without relying on IT to create a report. In particular, the tools must have a robust semantic layer to allow users to navigate available data sources. These tools should include a disconnected analysis capability that enables users to access BI content and analyze data remotely without being connected to a server-based BI application. In addition, these tools should offer query governance and auditing capabilities to ensure that queries perform well.
- Search-based BI — This applies a search index to both structured and unstructured data sources and maps them into a classification structure of dimensions and measures that users can easily navigate and explore using a search interface.
- Mobile BI — This capability enables organizations to deliver report and dashboard content to mobile devices (such as smartphones and tablets) in a publishing and/or interactive (bidirectional) mode, and takes advantage of the interaction mode of the device (tapping, swiping and so on) and other capabilities not commonly available on desktops and laptops, such as location awareness.
Moving from BI Platforms to Big Data Platforms
 Collecting terabytes of data per hour is not uncommon for today’s social networking, web- and high data volume-based companies.
Consider this…eBay’s “Singularity” Teradata warehouse exceeds 40 petabytes. According to eBay, the company’s data volumes are 50+ terabytes per day in new incremental data, processing 50+ petabytes
and tens of millions of queries per day, with 99.98% availability and more than 50 petabytes of online storage.
On the one hand, there is a growing IT challenge of storing and analyzing this data, and, on the other hand, there is an emerging need for innovative ways to extract value from the data which then in turn leads to new business models and new ways of doing things.
Summary: Information = Corporate Asset
Despite the technology and the underlying concepts being invented a few years ago, it is still difficult to leverage big data systematically today, and operational innovations like a CoE are required for its widespread adoption and embracement by an enterprise.
When is a CoE not right for an organization? If speed to value is very important to them…they can’t afford to do long “lead to value” projects, because they do not fit into the business reality. In this case we will see business users choosing a one-off approach. If a firm has disparate legacy environment. Legacy would take too long to fix. You accept your legacy as reality and focus on those guerilla projects that you can deliver quickly.
However in a “Build-to-Last” organization, true leaders will develop the capabilities required for making good and timely decisions in unpredictable and stressful environments. They will experiment but eventually execute with a portfolio (CoE) rather than a one-off approach.
 Notes and References

- Big data analytics is at the front of many successful corporations such as Target (Retail), American Express (Payments), Amazon (e-commerce), Facebook (social media) and so on. It is also the foundation of many startups in the area of the smart grid, e.g., building energy management. The latter is mostly concentrated on networks and relationships, while the former is relying on real-time streaming and analyses. See our posting on Big Data Use cases for an indepth look.
- Predictive Analytics 101 – A quick Primer
- BI/Analytics – Basics
- List of Vendors in the Predictive Analytics Space
- Explaining Big Data to the CEO – An Overview
Related articles
- The Role Of The CIO In Big Data Analytics (chucksblog.emc.com)
Trackbacks & Pingbacks
- Bloomberg on Business Analytics | Business Analytics 3.0
- Analytics (Prepared Minds) EC 6/22/12 - AdaptableOrg.com
- Apple IOS 6 Passbook: Enabling SoLoMoMe + Omni-channel Analytics | Business Analytics 3.0
- IBM CIO Study: BI and Analytics are #1 Priority for 2012 | Business Analytics 3.0
- 3 trends in Research, Analytics & Business Intelligence | janbrooijmans
- Data Visualization, Discovery and Visual Analytics – Tools, CoE | Business Analytics 3.0

Excellent article with good summary. What are your thoughts on combining Analytics and Social Collaboration for enabling Collaborative Decision Making ( CDM)? Lot of BI tool vendors are beginning to offer social collaboration layer.
LikeLike
Mani – Thanks for the feedback. I am sure social collaboration makes sense in some BI Use Cases (especially as firms move from listen/sense -to- act/respond phases of BI. An example is the integration of Chatter and Salesforce.com. However, specific to BI, the challenge is whether to embed these capabilities in the BI platform or create APIs to integrate with existing collaboration platforms like Sharepoint 2010. Have another collaboration solution where is knowledge resides tends to create more fragmentation. So it’s really an organizational tradeoff between
efficiency
(shorter time to decision),
effectiveness
(ability to cast a wide net and leverage existing platform assets).
LikeLike